HOT TOPICS LIST
- MACD
- Fibonacci
- RSI
- Gann
- ADXR
- Stochastics
- Volume
- Triangles
- Futures
- Cycles
- Volatility
- ZIGZAG
- MESA
- Retracement
- Aroon
INDICATORS LIST
LIST OF TOPICS
PRINT THIS ARTICLE
by Mark Rivest
See what stock market messages were sent on June 9, 2017.
Position: Sell
Mark Rivest
Independent investment advisor, trader and writer. He has written articles for Technical Analysis of Stocks & Commodities, Traders.com Advantage,Futuresmag.com and, Finance Magnates. Author of website Four Dimension Trading.
PRINT THIS ARTICLE
MARKET TIMING
Messages from a Split Stock Market
06/14/17 04:04:49 PMby Mark Rivest
See what stock market messages were sent on June 9, 2017.
Position: Sell
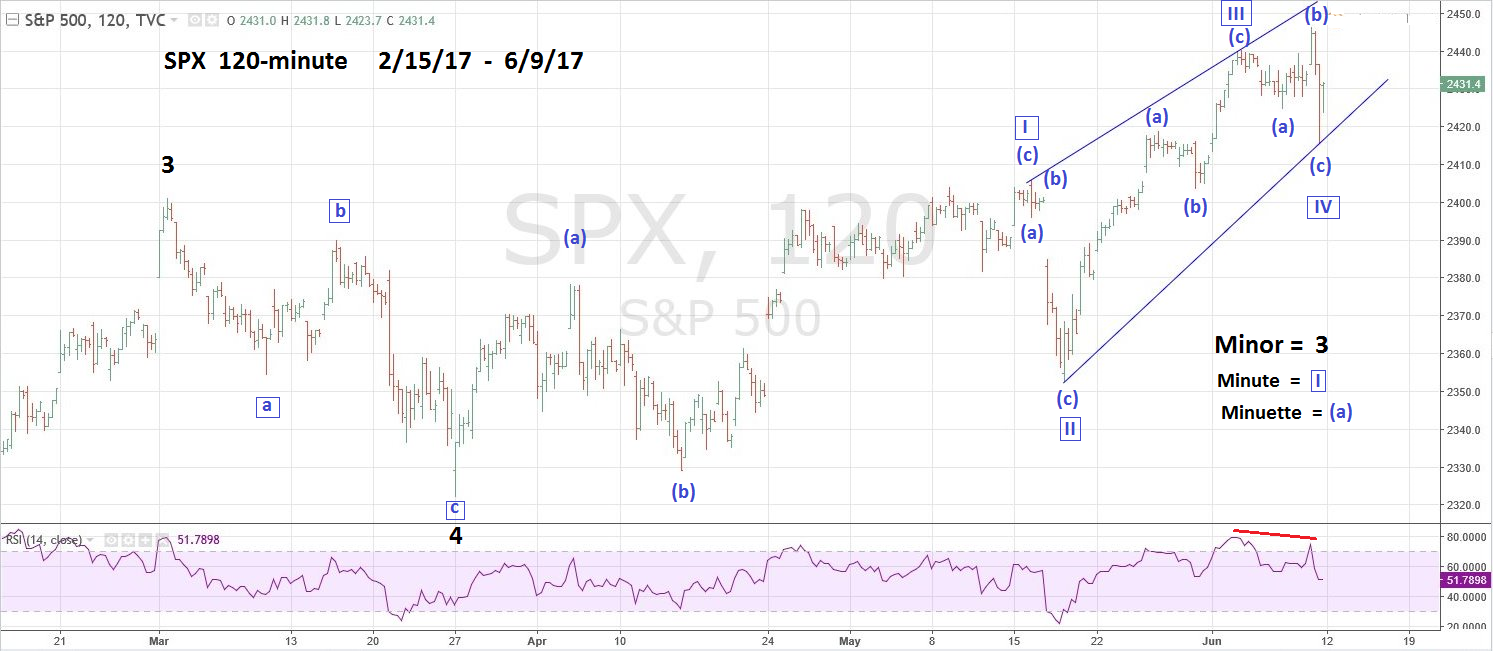
| Soon after making an all-time high on June 9, 2017, the Technology sector of the US stock market had a very sharp and deep decline dragging down most of the broader market. At the close, the condition of the US stock market was mixed. The Nasdaq 100 (NDX) was down 2.44% while the Dow Jones Industrial Average (DJIA) was up .42%. Two messages emerged from the day; the NDX decline is additional evidence of a developing stock market peak, and the DJIA ability to close the day up hints that the bull market can continue for at least a few days. Time and Price Dimensions On June 9th, the S&P 500 (SPX) moved above the high made on June 2 which was the last of four Fibonacci time cycles turn dates in the April-May seasonal topping zone. The next Fibonacci time cycle turn date is weeks away and the next seasonal topping zone is August to September. Could the SPX and the broader US stock market continue a steady rally into September? Perhaps, but there's a big obstacle in the way. Please see the 120 minute SPX chart illustrated in Figure 1. Also on June 9 the SPX broke a above a short-term Fibonacci price coordinate at 2440.84 — see my June 7 article "Convergence of Price and Time". The SPX close on June 9th was 2431.80 and could reach major Fibonacci resistance points at 2454.10 and 2459.30 in just a few trading days. My June 7 article speculated that the SPX had since March 27 formed a rare Elliott wave Expanding Diagonal Triangle. The SPX move above 2440 has changed the wave count to an Ending Diagonal Triangle which has converging trend lines. However, note that the supposed wave "four" of the structure does not cross over into the territory of the supposed wave "one" which almost always happens in this pattern. If the Ending Diagonal Triangle wave count is correct, the SPX could reach the upper trend line which crosses the 2450 area on June 13th or 14th. An alternate wave count has the supposed Ending Diagonal Triangle complete at the June 9 high of 2446.20. If the SPX moves below its June 9 bottom before exceeding 2446.20 it would imply the SPX has made an important peak at 2446.20. |

|
| Figure 1. If the Ending Diagonal Triangle wave count is correct the SPX could reach the upper trend line which crosses the 2450 area on June 13th or 14th. |
| Graphic provided by: Tradingview.com. |
| |
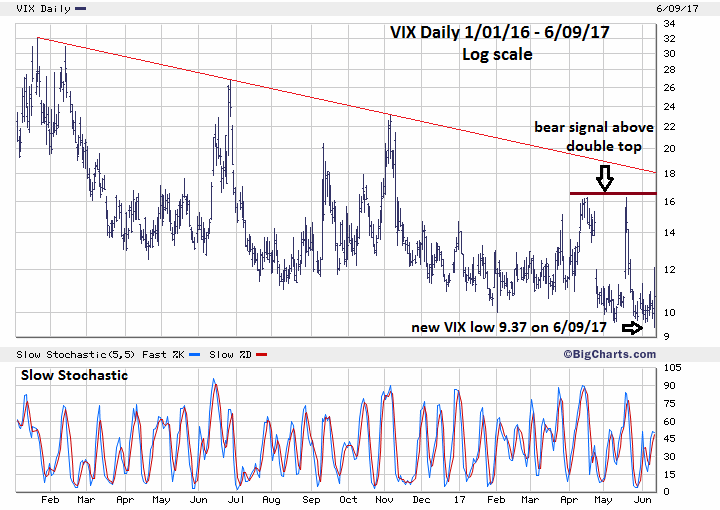
| Sentiment Dimension Please see the daily VIX chart illustrated in Figure 2. Several of my articles have noted that the VIX making a new low is a bullish signal for the SPX. On June 9, the VIX made a new low and is the strongest evidence the SPX could rally for at least a few days. Watch for the SPX to make a new high with the VIX above its June 9 low as a signal for what could be a significant SPX top. |

|
| Figure 2. Watch for the SPX to make a new high with the VIX above its June 9 low as a signal for what could be a significant SPX top. |
| Graphic provided by: BigCharts.com. |
| |
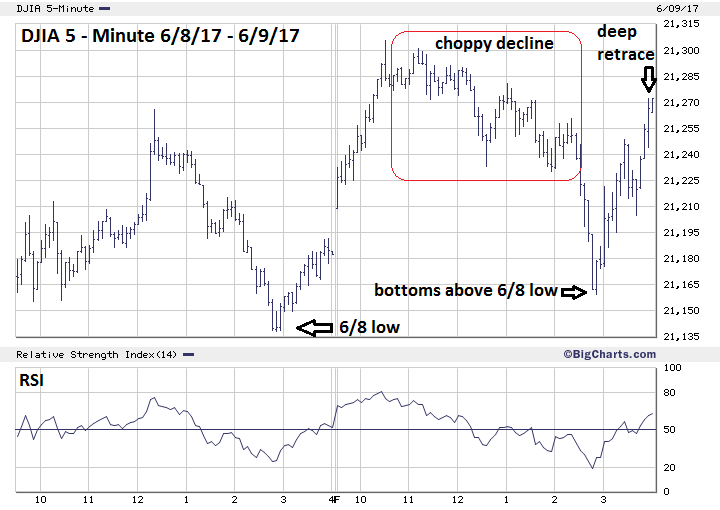
| Momentum Dimension The NDX decline from the high of June 9th to the low that same day was 4% — this is the largest one day decline since the close on June 23, 2016, to the low made on June 24, 2016. That decline was 4.3% and just before the Brexit bottom made on June 27th. The next big NDX decline prior to June 2016 came in August 2015. The NDX from the close on August 21, 2015 to the low of August 24, 2015 was a 9.7% decline — this was the completion of the August mini crash. The June 9, 2017 decline came immediately after making an all-time NDX high while the prior large down days came at or near the end of corrections which is typically where the largest part of a decline occurs. If NDX has begun a correction on June 9 with a 4% drop, could this be a signal that the end of the correction will be much larger than 4%? Additionally, the June 9 decline is believed to have been triggered by a bearish Goldman Sachs report on five companies: Facebook (FB), Apple (AAPL), Amazon.com (AMZN), Microsoft (MSFT), and Alphabet (GOOGL). These five stocks make up about 13% of the SPX and account for 40% of the SPX year to date performance. On June 9, all five stocks had twice their 50-day average volume. Rapid selling on heavy volume implies funds were liquidated, which up to that day were their best performing stocks. On the other side of the coin the DJIA gave a bullish signal. Please see the 5 minute DJIA chart illustrated in Figure 3. The NDX June 9 decline from top to bottom was virtually a straight line. Typically, in Elliott wave theory this is the signature of the primary trend. The DJIA June 9 decline is choppy, which is the signature of corrections to the primary trend. DJIA failed to break below the bottom made on June 8 and the subsequent rally went above a .618 retrace of the prior decline. These three factors imply the DJIA could rally back at least to the all-time high. Additional short term bullish evidence comes from the Russell 2000 (RUT) which was up on June 9 at an all-time high. Also, five of the nine S&P 500 sector ETF's were up. |

|
| Figure 3. These three factors imply the DJIA could rally back at least to the all-time high. |
| Graphic provided by: BigCharts.com. |
| |
| Summary and Strategy Rapid and heavy selling of top performing stocks is another factor to be added to the already enormous list of bearish evidence that has been chronicled in my articles. Short term evidence from VIX, DJIA, and sectors is bullish. The weight of the evidence suggests that the stock bull market is alive at least into the week of June 12-16. Hold short 50% stocks and use SPX 2510 as a stop loss. If the SPX reaches 2450-2460 in mid-June 2017 it could be the biggest stock market turn since March of 2009. Further Reading: Frost A.J and Robert Prechter (1985) "Elliott Wave Principle", New Classics Library. |
Independent investment advisor, trader and writer. He has written articles for Technical Analysis of Stocks & Commodities, Traders.com Advantage,Futuresmag.com and, Finance Magnates. Author of website Four Dimension Trading.
| Website: | www.fourdimensiontrading.com |
| E-mail address: | markrivest@gmail.com |
Click here for more information about our publications!
Comments

Request Information From Our Sponsors
- StockCharts.com, Inc.
- Candle Patterns
- Candlestick Charting Explained
- Intermarket Technical Analysis
- John Murphy on Chart Analysis
- John Murphy's Chart Pattern Recognition
- John Murphy's Market Message
- MurphyExplainsMarketAnalysis-Intermarket Analysis
- MurphyExplainsMarketAnalysis-Visual Analysis
- StockCharts.com
- Technical Analysis of the Financial Markets
- The Visual Investor
- VectorVest, Inc.
- Executive Premier Workshop
- One-Day Options Course
- OptionsPro
- Retirement Income Workshop
- Sure-Fire Trading Systems (VectorVest, Inc.)
- Trading as a Business Workshop
- VectorVest 7 EOD
- VectorVest 7 RealTime/IntraDay
- VectorVest AutoTester
- VectorVest Educational Services
- VectorVest OnLine
- VectorVest Options Analyzer
- VectorVest ProGraphics v6.0
- VectorVest ProTrader 7
- VectorVest RealTime Derby Tool
- VectorVest Simulator
- VectorVest Variator
- VectorVest Watchdog
