

HOT TOPICS LIST
- MACD
- Fibonacci
- RSI
- Gann
- ADXR
- Stochastics
- Volume
- Triangles
- Futures
- Cycles
- Volatility
- ZIGZAG
- MESA
- Retracement
- Aroon
INDICATORS LIST
LIST OF TOPICS
PRINT THIS ARTICLE
by Mark Rivest
See why 2532.69 is a key price point on the S&P 500.
Position: N/A
Mark Rivest
Independent investment advisor, trader and writer. He has written articles for Technical Analysis of Stocks & Commodities, Traders.com Advantage,Futuresmag.com and, Finance Magnates. Author of website Four Dimension Trading.
PRINT THIS ARTICLE
MARKET PROFILE
Stock Market Rosetta Stone
03/08/18 04:13:22 PMby Mark Rivest
See why 2532.69 is a key price point on the S&P 500.
Position: N/A
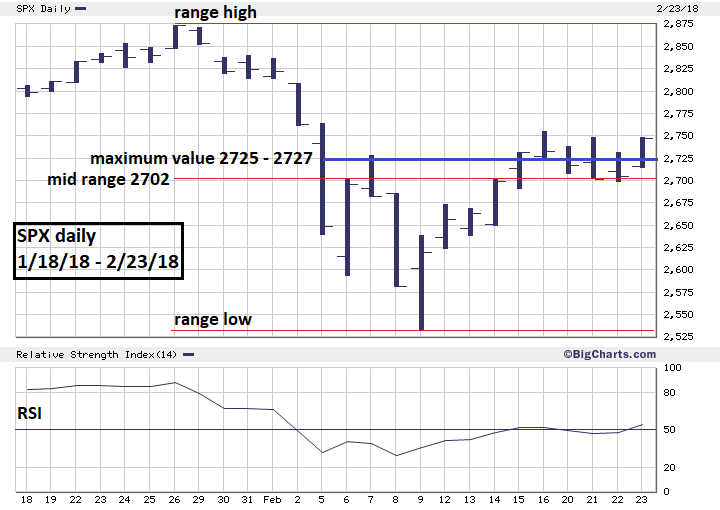
| The Rosetta Stone discovered in 1799 proved to be the key in deciphering Egyptian hieroglyphs. In the next few weeks S&P 500 (SPX) 2532.69 could be the key to deciphering the direction of US stocks. So far since February 9 the direction is up, however we must be on the alert for a sudden change in direction. If the SPX breaks below 2532.69 it could trigger a vicious move down. The Market Profile In their terrific book "Mind Over Markets" authors James F. Dalton, Eric T. Jones and Robert B. Dalton detail the Market Profile. They describe the profile as a conduit for listening to the market. It's a graph that plots time on one axis and price on the other to give a visual impression of market activity. The representation takes the form of a statistical bell curve. The method is used mostly for day trading and breaks each trading day into half hour blocks called Time Price Opportunities (TPO). The first hour of a trading day is the initial balance and sets the tone for the rest of the trading day. Please see the SPX daily chart illustrated in Figure 1. For purposes of this illustration consider each trading day a TPO. An important aspect of the Market Profile is determining value. The maximum value area is called Point of Control (POC). The first step in discovering POC is determining the mid-point of the range. In the illustration the mid-point for the SPX rounded to the nearest point is 2702. The next step is to discover the longest line of TPO's closest to the center of the range. For this illustration, prices 2725-2727 crossed eight trading days, this is the price area of maximum value. The POC can rise/fall with the market. For example, on February 16, 2018 the SPX-POC was 2637-2668. In one-week value has risen along with price. The SPX close on February 23 was 2747 only 20 points above POC and is a bullish clue because price has not extended too far beyond value. |
|
| Figure 1. For this illustration prices 2725�2727 crossed eight trading days, this is the price area of maximum value. |
| Graphic provided by: BigCharts.com. |
| |
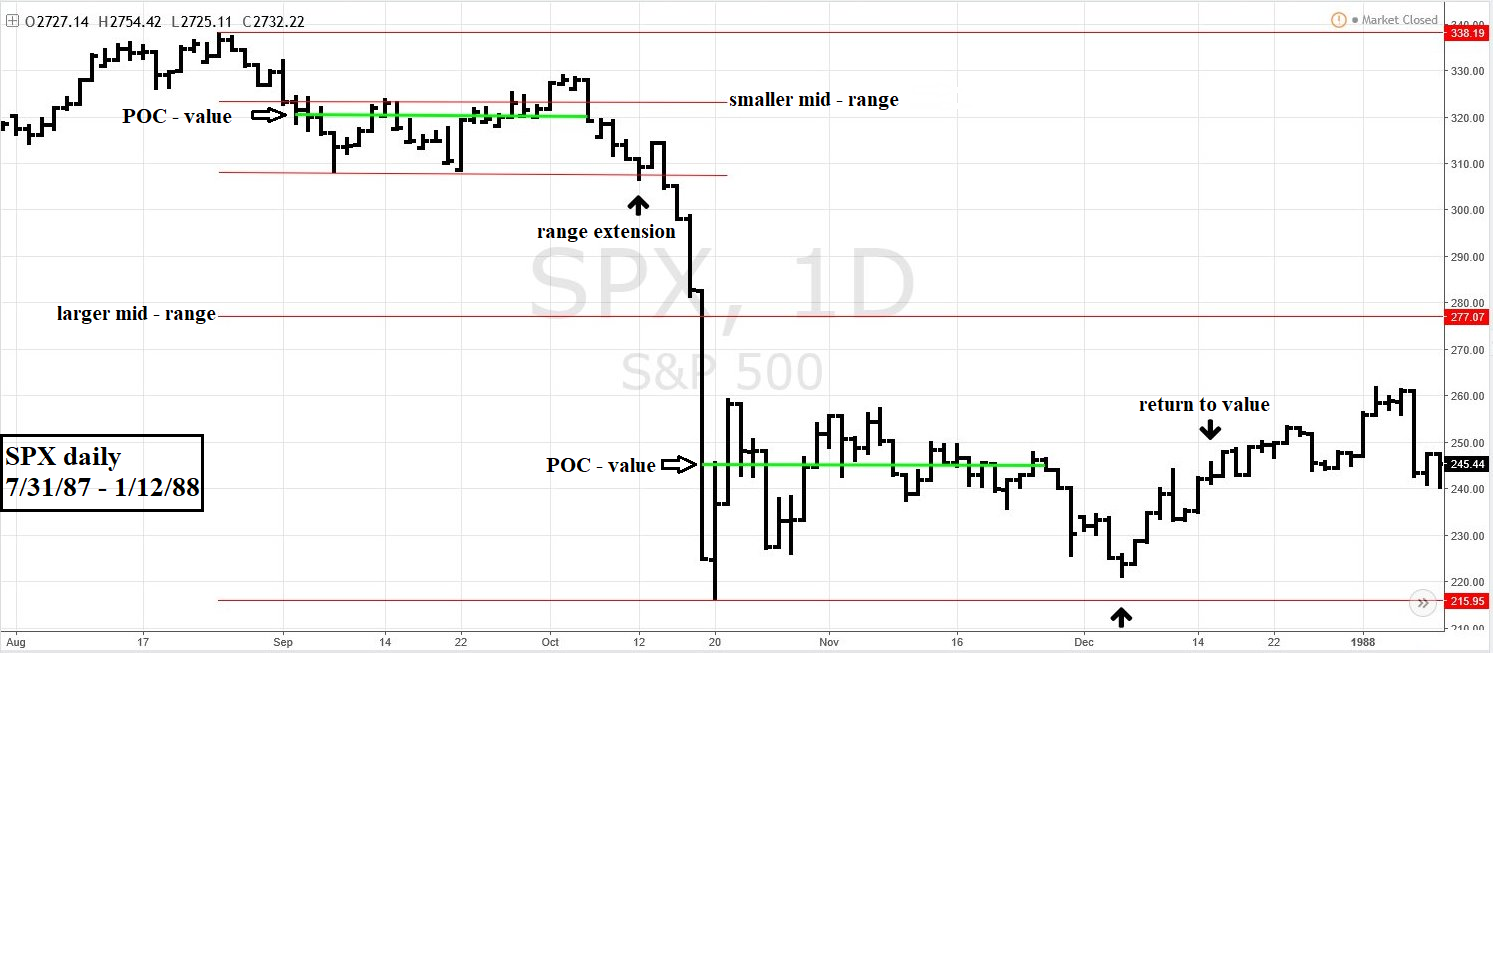
| S&P 500 during the 1987 crash On August 25, 1987 the SPX topped at 337.89, nine trading days later it had decline 8.6% to 308.56, very similar to the recent 11.8% drop in ten trading days. In 1987 the SPX Rosetta Stone was 308.56, a breach below that level triggered a crash. Please see the daily SPX chart 7/31/87 - 1/12/88 illustrated in Figure 2. After the bottom at 308.56 the SPX established POC in the 320 area and then traded above this maximum value zone. It appeared price was headed for a new high but changed direction and quickly broke below value. The speed of the break was the first clue that something more bearish could be developing. The next clue was a break below the range low, this is called range extension. When day trading, a downside range extension usually means the bears are in control for the remainder of the trading day. The reverse for upside range extension. In the 1987 breach of 308.56 this implied greater success initiating or holding bearish positions. After the bottom at 216.47 a new value area was established around 245. After November 26th price quickly move below POC and appeared to be headed to another downside range extension below 216.47. However, on December 4, price held above the range low and in the next several trading days rallied. December 16 was a very important day as price moved above POC strongly implying the bulls were back in control. After this significant day the SPX traded sideways with only a marginal move below POC. This was the beginning of a multi-month rally that eventually led to a new all-time high. |
|
| Figure 2. December 16 was a very important day as price moved above POC strongly implying the bulls were back in control. |
| Graphic provided by: tradingview.com. |
| |
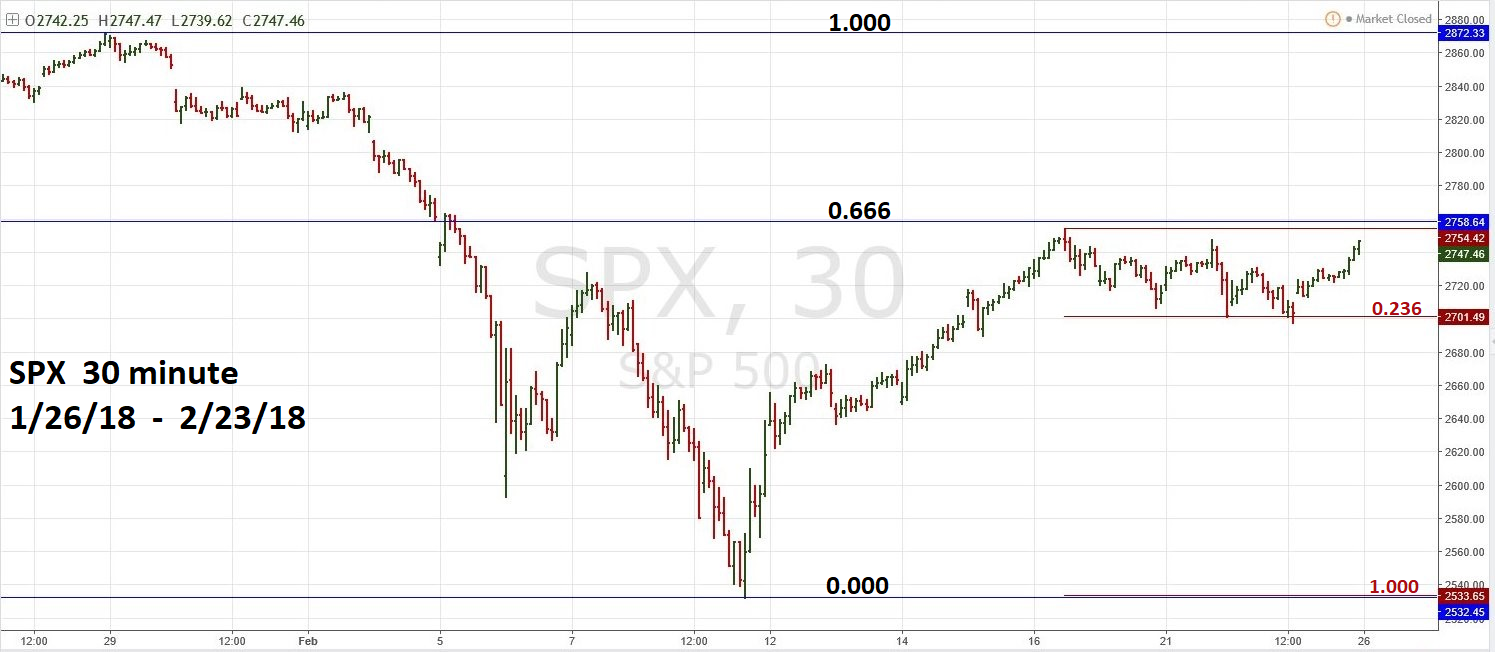
| SPX Intraday Chart In "Mind Over Markets" the authors ask two important questions. "Which way is the market trying to go? And is it doing a good job in its attempt to go that way?" Please see the SPX 30 - minute chart illustrated in Figure 3. Since the February 9 bottom the SPX has been going up and it's doing a very job in going that way. The initial rally was smooth and fast with tiny corrections. After topping just below the outlier Fibonacci retrace level of .666 the decline was choppy and slow, retracing only a shallow .236 of the prior rally. On February 23 the SPX closed just below the high of the day and had retraced almost all the prior declines struggled progress. The bulls are in control, a break above .666 resistance will open the door to a new all-time high. As traders we must always keep an open mind that at anytime a trend can reverse. Two factors in the bearish case are, the briefness of the recent ten trading day decline, and the similarity to the decline just prior to the 1987 crash. If the SPX fails to exceed the high at 2872.87 and quickly drops below the maximum value area at 2725-2727, it could be the first clue that something more bearish is developing. |
|
| Figure 3. Since the February 9 bottom the SPX has been going up and it's doing a very job in going that way. |
| Graphic provided by: tradingview.com. |
| |
| Conclusion The evidence presented in my February 15 article "S&P 500 Deadly Ground" and the Market Profile strongly suggest the US stock market could continue to rally. For the bears to regain control speed is required. A quick move below SPX 2725-2527 is the first step. If the SPX quickly goes below 2532.69 it could be a signal to go short and open the door for a rapid 15% decline. The ability to quickly change your opinion on a market when the evidence of market direction suddenly changes can significantly enhance profitability. Great traders have the trait of mental flexibility. For you, this could be the most important market Rosetta Stone. Further Reading: Dalton James. F, Jones Eric. T & Dalton Robert. B (1993) "Mind Over Markets" Traders Press Inc. Dalton James. F, Jones Eric. T & Dalton Robert. B (2007) "Markets in Profile" John Wiley & Sons, Inc. |
Independent investment advisor, trader and writer. He has written articles for Technical Analysis of Stocks & Commodities, Traders.com Advantage,Futuresmag.com and, Finance Magnates. Author of website Four Dimension Trading.
| Website: | www.fourdimensiontrading.com |
| E-mail address: | markrivest@gmail.com |
Click here for more information about our publications!
Comments
Date:�03/09/18Rank:�4Comment:�

Request Information From Our Sponsors
- VectorVest, Inc.
- Executive Premier Workshop
- One-Day Options Course
- OptionsPro
- Retirement Income Workshop
- Sure-Fire Trading Systems (VectorVest, Inc.)
- Trading as a Business Workshop
- VectorVest 7 EOD
- VectorVest 7 RealTime/IntraDay
- VectorVest AutoTester
- VectorVest Educational Services
- VectorVest OnLine
- VectorVest Options Analyzer
- VectorVest ProGraphics v6.0
- VectorVest ProTrader 7
- VectorVest RealTime Derby Tool
- VectorVest Simulator
- VectorVest Variator
- VectorVest Watchdog
- StockCharts.com, Inc.
- Candle Patterns
- Candlestick Charting Explained
- Intermarket Technical Analysis
- John Murphy on Chart Analysis
- John Murphy's Chart Pattern Recognition
- John Murphy's Market Message
- MurphyExplainsMarketAnalysis-Intermarket Analysis
- MurphyExplainsMarketAnalysis-Visual Analysis
- StockCharts.com
- Technical Analysis of the Financial Markets
- The Visual Investor