

HOT TOPICS LIST
- MACD
- Fibonacci
- RSI
- Gann
- ADXR
- Stochastics
- Volume
- Triangles
- Futures
- Cycles
- Volatility
- ZIGZAG
- MESA
- Retracement
- Aroon
INDICATORS LIST
LIST OF TOPICS
PRINT THIS ARTICLE
by Mark Rivest
See why a mini stock market crash could happen in August 2017.
Position: Sell
Mark Rivest
Independent investment advisor, trader and writer. He has written articles for Technical Analysis of Stocks & Commodities, Traders.com Advantage,Futuresmag.com and, Finance Magnates. Author of website Four Dimension Trading.
PRINT THIS ARTICLE
MARKET TIMING
Amazing Parallels of 2015 and 2017
08/03/17 01:12:32 PMby Mark Rivest
See why a mini stock market crash could happen in August 2017.
Position: Sell
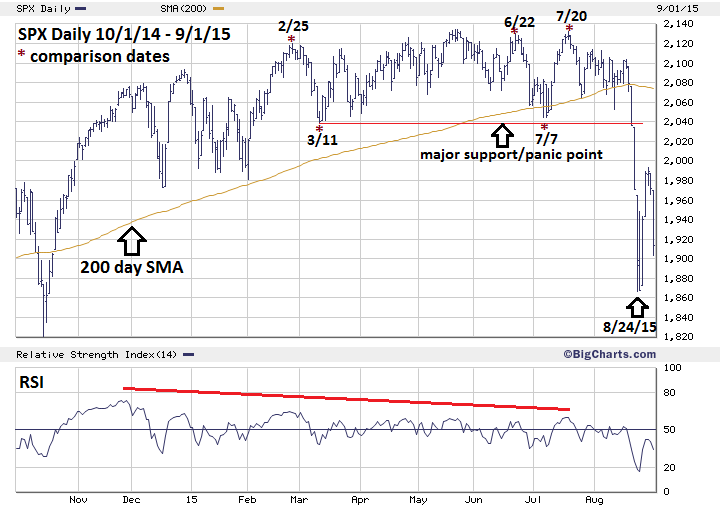
| In July 2015, the Nasdaq made an all-time high that was unconfirmed by nearly every other stock index. Details of the top are noted in my July 30, 2015 article "A Ludicrous Non-Confirmation". My next article "Analyze This", August 10, 2015, examined the parallels between the S&P 500 (SPX) in 2011 and 2015, which illustrated clues that a mini stock market crash could occur in August 2015. Later in August 2015, there was a mini crash that culminated on August 24, 2015. Evidence indicates that conditions are ripe for another mini crash in August 2017. 2011 Peak vs 2015 Peak Please see the 2014-2015 SPX chart illustrated in Figure 1. My August 10,2015 article noted similarities in price patterns of the SPX in 2011 compared to 2015. The March 2, 2011 correction bottom and the May 20, 2015 correction bottom both represented major support. Also noted that in 2011 when the SPX broke below both the major support and the 200-day Simple Moving Average (SMA) the result was a mini crash. When the SPX broke below major support and the 200-day SMA on August 21, 2015, the result was a decline of 167.10 points, or 8.2%, in just two trading days. |
|
| Figure 1. When the SPX broke below major support and the 200-day SMA on August 21, 2015, the result was a decline of 167.10 points, or 8.2%, in just two trading days. |
| Graphic provided by: BigCharts.com. |
| |
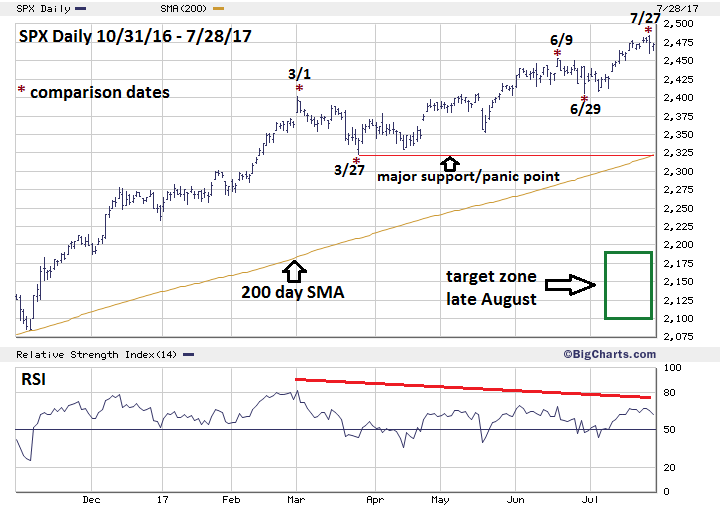
| 2015 Peak vs 2017 Peak Please see the 2016-2017 SPX chart illustrated in Figure 2. The March 1-27 correction in 2017 corresponds with the February 25-March 11 correction in 2015. The SPX bottom at 2322.30 made on March 27, 2017 represents major support. If within the next few weeks the SPX broke below this level and the 200-day SMA, it could trigger another rush to the exit, just like in 2011 and 2015. If the SPX in 2017 falls 8.2% from 2322, the 2130 area could be reached in just a few trading days. |
|
| Figure 2. If the SPX in 2017 falls 8.2% from 2322, the 2130 area could be reached in just a few trading days. |
| Graphic provided by: BigCharts.com. |
| |
| Fibonacci Price Parallels My May 10, 2017 article "The Price is Right" noted two major Fibonacci price coordinates where the SPX could find resistance. The first was calculated from the growth rate 35.58% of the June 2010-May 2011 rally. Adding growth of 35.58% to the February 2016 bottom at 1810.10 targeted SPX 2454.10 as possible resistance. The second calculation was derived from the May 2015-February 2016 decline of 324.60 points, multiplied by two equals 649.20, added to the bottom at 1810.10 targets SPX 2459.30. Noted in several articles — allow for wide leeway when using coordinates calculated from price structures formed years ago. Both coordinates are still valid to target a broad resistance zone. There's now a third major Fibonacci price coordinate that has a direct link to the SPX peak made in 2015. Please see my June 8, 2015 article "The Golden Section". This article noted that the SPX bear market 2007-2009 was 909.30 points multiplied by 1.618 equaled 1471.20 added to the March 2009 bottom of 666.80 targeted SPX 2138.00. The SPX high in May 2015 was 2134.70 and the retest in July 2015 was at 2132.80. Now, take the 2007-2009 decline of 909.30, multiply it by the next Fibonacci ratio of 2/1 which yields 1818.60 points added to SPX 666.80 targets 2485.40 as resistance. The SPX high on July 27, 2017 was 2484.00. |
| Momentum Parallels The SPX July 2015 peak had multiple daily RSI momentum divergences. The July 2017 SPX top also has multiple daily RSI momentum divergences. My July 14, 2017 article "A Ludicrous Non-Confirmation - The Sequel" noted that the July 2015 Nasdaq Composite (COMP) peak was confirmed only by the Nasdaq 100 and five of the nine SPDR sector funds. On July 27, 2017, the three main US stock indices, SPX, COMP, and Dow Jones Industrial Average (DJIA), tops were confirmed by two secondary stock indices, Nasdaq 100 and S&P 100. Two of the nine SPDR sector funds, Consumer Discretionary (XLY) and Technology (XLK) confirmed the July 27th top. On July 28, 2017, the DJIA made an all-time high that was confirmed by nothing. On July 27, 2017, there were 163 NYSE stocks making new 52-week highs. On December 9, 2016, there were 778 NYSE stocks making new 52-week highs. On July 20, 2015, there were 220 NYSE stocks making new 52-week highs. On December 23, 2014, there were 569 NYSE stocks making new 52-week highs. |
| Conclusion and Strategy The overwhelming amount of bearish evidence and the amazing parallels between 2011, 2015 and 2017 indicate that a mini stock market crash could occur in the second half of August 2017. Hold 50% short stocks and use SPX 2510 as a stop loss. If not currently short stocks, get short as soon as possible. If the SPX breaks below 2322.30 increase the short position to 100% and use SPX 2370 as the stop for the second 50%. "Those who cannot remember the past are condemned to repeat it" - George Santayana. Complacent stock traders in 2017 who can't remember or don't even know what happened in 2011 and 2015 could be on the same portfolio smashing path. Further Reading: Frost A.J and Robert Prechter (1985) "Elliott Wave Principle", New Classics Library. |
Independent investment advisor, trader and writer. He has written articles for Technical Analysis of Stocks & Commodities, Traders.com Advantage,Futuresmag.com and, Finance Magnates. Author of website Four Dimension Trading.
| Website: | www.fourdimensiontrading.com |
| E-mail address: | markrivest@gmail.com |
Click here for more information about our publications!
Comments
Date:�08/05/17Rank:�5Comment:�

Request Information From Our Sponsors
- StockCharts.com, Inc.
- Candle Patterns
- Candlestick Charting Explained
- Intermarket Technical Analysis
- John Murphy on Chart Analysis
- John Murphy's Chart Pattern Recognition
- John Murphy's Market Message
- MurphyExplainsMarketAnalysis-Intermarket Analysis
- MurphyExplainsMarketAnalysis-Visual Analysis
- StockCharts.com
- Technical Analysis of the Financial Markets
- The Visual Investor
- VectorVest, Inc.
- Executive Premier Workshop
- One-Day Options Course
- OptionsPro
- Retirement Income Workshop
- Sure-Fire Trading Systems (VectorVest, Inc.)
- Trading as a Business Workshop
- VectorVest 7 EOD
- VectorVest 7 RealTime/IntraDay
- VectorVest AutoTester
- VectorVest Educational Services
- VectorVest OnLine
- VectorVest Options Analyzer
- VectorVest ProGraphics v6.0
- VectorVest ProTrader 7
- VectorVest RealTime Derby Tool
- VectorVest Simulator
- VectorVest Variator
- VectorVest Watchdog