

HOT TOPICS LIST
- MACD
- Fibonacci
- RSI
- Gann
- ADXR
- Stochastics
- Volume
- Triangles
- Futures
- Cycles
- Volatility
- ZIGZAG
- MESA
- Retracement
- Aroon
INDICATORS LIST
LIST OF TOPICS
PRINT THIS ARTICLE
by Mark Rivest
Could US stocks make a major top in early 2021?
Position: N/A
Mark Rivest
Independent investment advisor, trader and writer. He has written articles for Technical Analysis of Stocks & Commodities, Traders.com Advantage,Futuresmag.com and, Finance Magnates. Author of website Four Dimension Trading.
PRINT THIS ARTICLE
MARKET TIMING
Entering The End Game
01/14/21 02:48:27 PMby Mark Rivest
Could US stocks make a major top in early 2021?
Position: N/A
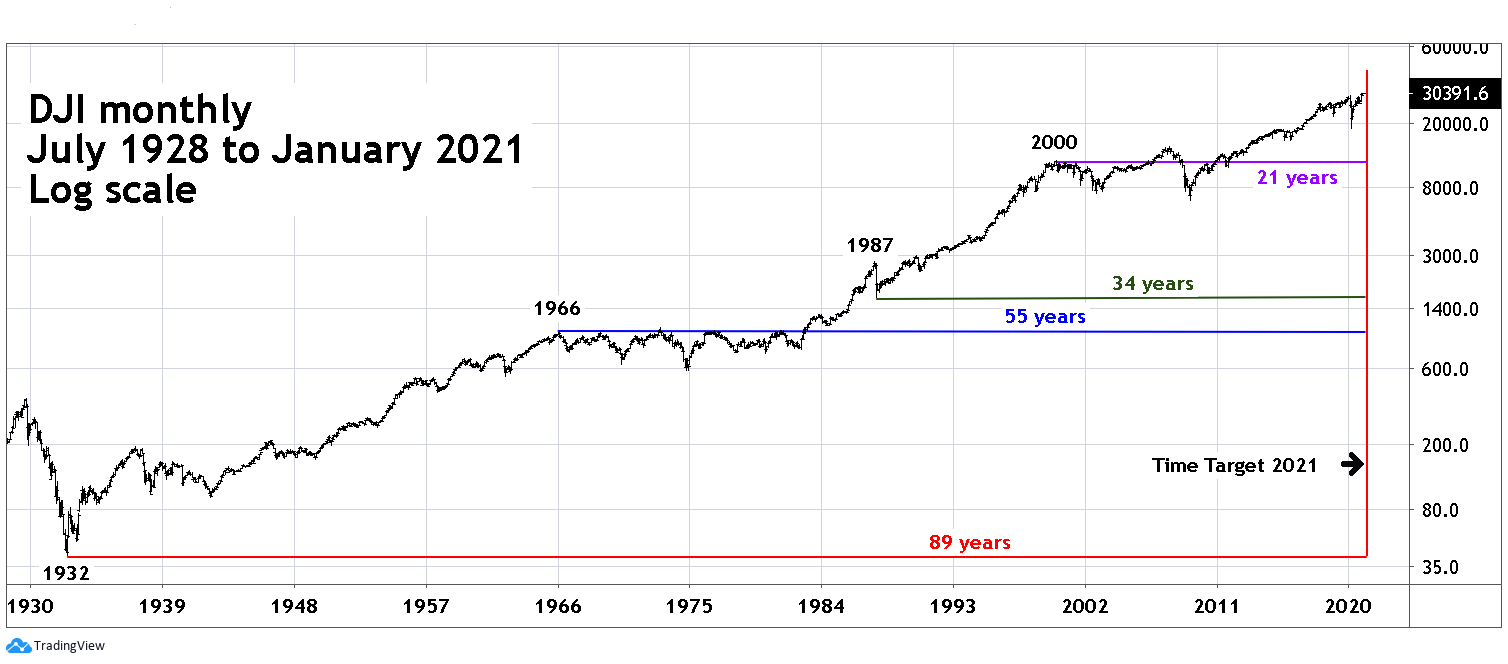
| The rally in US stocks as measured by the S&P 500 (SPX) since the March 2020 bottom has been one of the most powerful in history. As of 01/08/21 the SPX has risen 74.5% off the 03/23/20 crash low. The next nearest nine-month gain was 72.5% made March 2009 to January 2010 — the bulk of the kickoff phase for the secular bull market. Putting this in perspective of an even larger time frame, only the Dow Jones Industrial Average rallies in the mid-1930's made greater gains. Evidence is gathering that the stock mania could soon end. The Big Picture The Fibonacci sequence and Fibonacci ratios can be used for price/time analysis. The Fibonacci sequence is: 1, 1, 2, 3, 5, 8, 13, 21, 34, 55, 89, 144, 233, .... to infinity. RN Elliott was the first to discover that markets can be measured by the Fibonacci time sequence. For example, the 1929 to 1932 bear market was 34 months. The 1932 to 1937 bull market was 5 years. Later, Robert Prechter's book "Beautiful Pictures" illustrated hundreds of Fibonacci price and time relationship within the Dow Jones Industrial Average (DJI) secular bull market from July 1932 to January 2000. Please see the monthly DJI chart illustrated in Figure 1. This is an update to the monthly DJI chart illustrated in my 01/09/20 article "Forecast For US Stocks In 2020" it shows that four of the most significant DJI turns in the Twentieth century (1932,1966, 1987, and 2000) are all connected by the Fibonacci sequence. The 01/09/20 article noted that the sequence pointed to a potential significant turn, not a top or bottom. Price action into a turn point determines if it could be a high or a low. US stock have now rallied into 2021 indicating a potential peak. But when in 2021? That's a big ballpark and we need to use other tools to narrow the focus. |
|
| Figure 1. US stocks have now rallied into 2021 indicating a potential peak. |
| Graphic provided by: TradingView. |
| |
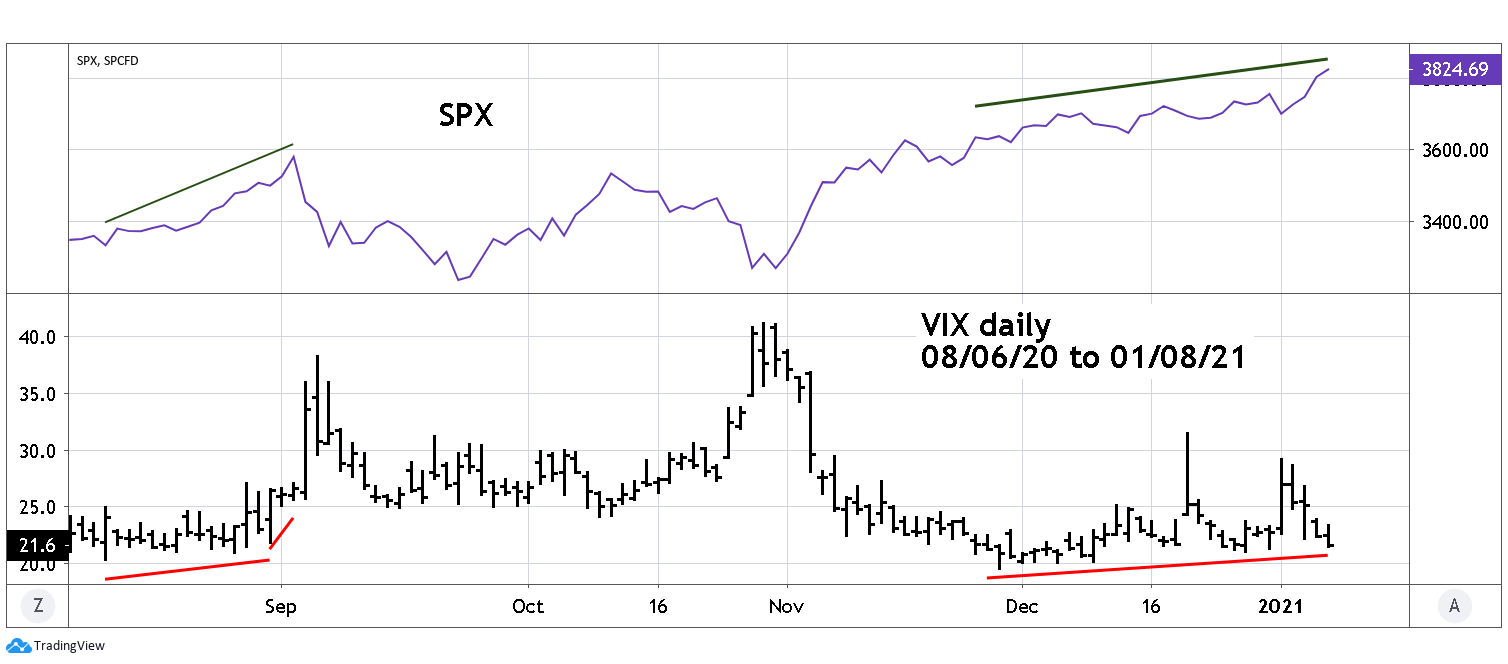
| VIX Indicator Chicago Board Options Exchange's CBOE Volatility Index, known as VIX, measures volatility of the SPX. Upward VIX spikes often occur near, or at, SPX bottoms which makes it an excellent tool to measure bearish sentiment. Sometimes the VIX can be used to discover SPX tops. Please see the daily VIX and SPX chart illustrated in Figure 2. A common misconception is that if the VIX is making an extreme low it means an SPX top. However, note that just prior to the September 2020 correction the VIX had a series of rising bottoms. The same phenomenon as of 01/08/21 is occurring. Unless the VIX breaks below its 11/27/20 bottom the divergence message implies an SPX decline could happen very soon. The degree of a possible near-term drop could be determined by another analytical tool. |
|
| Figure 2. A common misconception is that if the VIX is making an extreme low it means an SPX top. |
| Graphic provided by: TradingView. |
| |
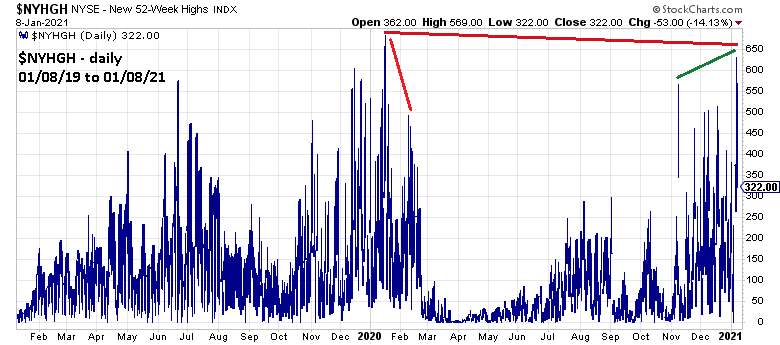
| NYSE - New 52-Week Highs Analysis of the NYSE New 52-week highs was discussed in my 12/20/19 article "Stock Market Momentum Cycles" and my 09/11/20 article "Elliott-Stock Market - Third Waves". As a stock bull market ages there are usually fewer stocks making new 52-week highs. At some point there aren't enough stocks making new highs and the bull move terminates. The 12/20/19 article noted that the maximum number of new NYSE highs came in the middle portion of the larger degree Elliott Wave count that began in March 2009. This middle part occurred from 2012 to 2013. Subsequent phases of the secular bull market have had fewer new highs. Additionally, there are bearish divergences of new highs within each phase. Please see the daily NYSE New 52-week high chart illustrated in Figure 3. Note that the maximum number of new highs occurred about a month before the price peak of that phase occurred in February 2020. The most recent phase that began in March 2020 recorded its highest number of new highs in the first week of January 2021. This implies a price peak could happen at least several weeks after early January. The number of new highs for the current phase is still below the maximum number of new highs from the prior phase. If in the near future, new 52-week high were to exceed the maximum new highs made in January 2020 it could open the door for new all-time price highs in the later part of 2021 and perhaps into 2022. On the bearish side of the coin, the 2009 to 2010 kickoff phase of the secular bull market had a corresponding peak in price and new 52-week highs. So, it's possible another corresponding price/momentum top is happening in early January 2021. However, so far there are three successively bearish momentum phase highs (2016,2020, and 2021). The probabilities point to yet another bearish divergence occurring in the current phase — 2020 to 2021. |
|
| Figure 3. The number of new highs for the current phase is still below the maximum number of new highs from the prior phase. |
| Graphic provided by: StockCharts.com. |
| |
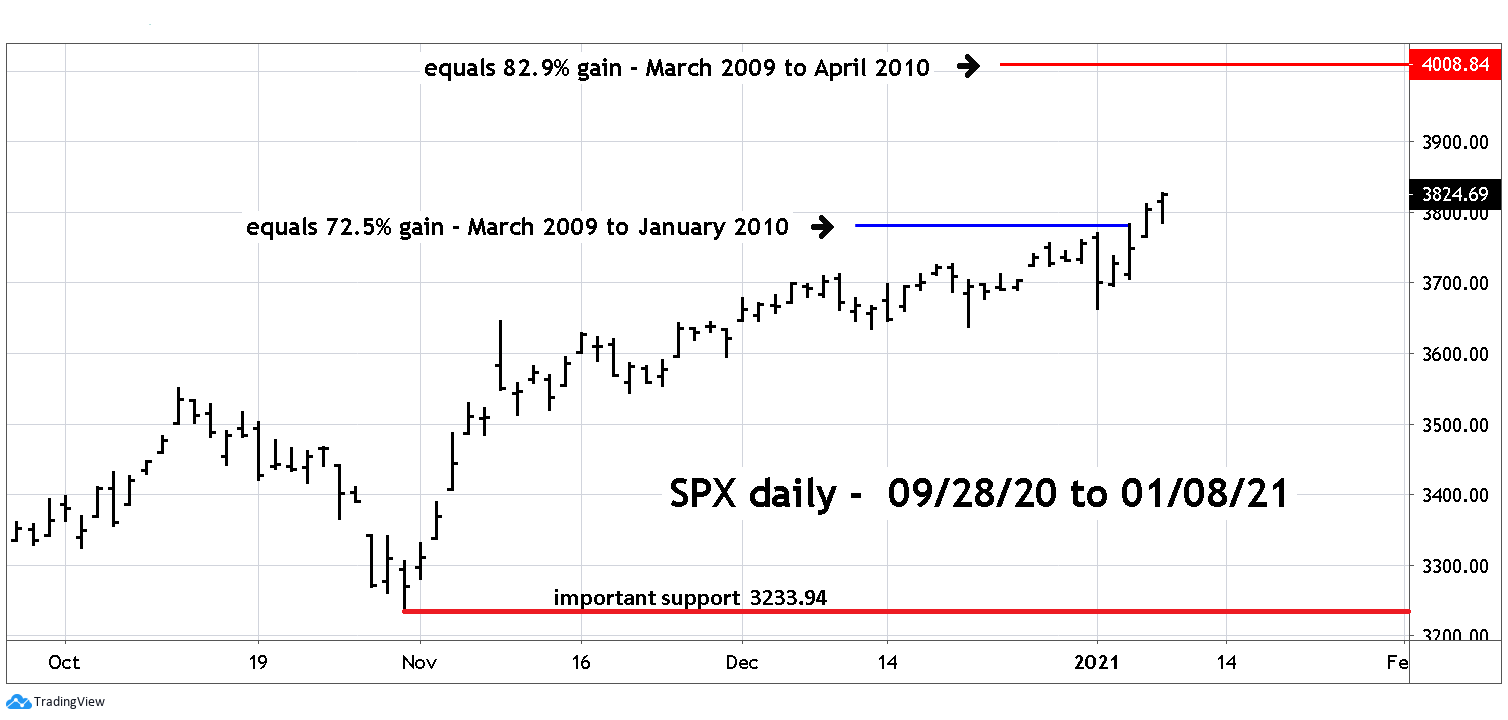
| Price Targets My 12/30/20 article "Long-term Elliott Wave Perspective For US Stocks" noted that the SPX rally from March 2020 could have the same growth rate as the SPX 2009 to 2010 rally. Please see the daily SPX chart illustrated in Figure 4. So far, the SPX has matched the growth rate of the SPX March 2009 to January 2010 bull run. After the January 2010 penultimate peak there was a 9% decline followed by the final rally into the April 2010 kickoff wave top. If there's an early January 2021 top there could be about an 8 to 10% drop prior to a final run up. If a near-term decline breaks below the 10/30/10 SPX bottom at 3233.94 it could imply the start of a much larger bear move. |
|
| Figure 4. If there's an early January 2021 top there could be about an 8 to 10% drop prior to a final run up. |
| Graphic provided by: TradingView. |
| |
| Time Targets There are three time zones in the first half of 2021 where a significant top could occur. The first is early January, primarily because of deferred tax selling. The first trading day of 2005 was the start of a minor correction. Early January 2000 and in 1973 tops marked the beginning of major bear markets. The next candidate — March 2021 is a Fibonacci 144 months since the secular bull market began in March 2009. The third candidate time zone is late April/early May. There have been seasonal peaks five times during the secular bull market that began in March 2009 (2010, 2011, 2012, 2015, and 2019) Evidence from the NYSE New 52-week highs favors a significant top happening in March or perhaps late April/ early May. Since late March 2020 it's been a fabulous time for stock bulls. Perhaps at some point in 2021 it could be a fabulous time for stock bears. Further Reading: Frost A.J and Robert Prechter (1985) "Elliott Wave Principle", New Classics Library. Prechter Jr. R. Robert (2003) "Beautiful Pictures", New Classics Library. |
Independent investment advisor, trader and writer. He has written articles for Technical Analysis of Stocks & Commodities, Traders.com Advantage,Futuresmag.com and, Finance Magnates. Author of website Four Dimension Trading.
| Website: | www.fourdimensiontrading.com |
| E-mail address: | markrivest@gmail.com |
Click here for more information about our publications!
Comments
Date:�01/16/21Rank:�5Comment:�

Request Information From Our Sponsors
- StockCharts.com, Inc.
- Candle Patterns
- Candlestick Charting Explained
- Intermarket Technical Analysis
- John Murphy on Chart Analysis
- John Murphy's Chart Pattern Recognition
- John Murphy's Market Message
- MurphyExplainsMarketAnalysis-Intermarket Analysis
- MurphyExplainsMarketAnalysis-Visual Analysis
- StockCharts.com
- Technical Analysis of the Financial Markets
- The Visual Investor
- VectorVest, Inc.
- Executive Premier Workshop
- One-Day Options Course
- OptionsPro
- Retirement Income Workshop
- Sure-Fire Trading Systems (VectorVest, Inc.)
- Trading as a Business Workshop
- VectorVest 7 EOD
- VectorVest 7 RealTime/IntraDay
- VectorVest AutoTester
- VectorVest Educational Services
- VectorVest OnLine
- VectorVest Options Analyzer
- VectorVest ProGraphics v6.0
- VectorVest ProTrader 7
- VectorVest RealTime Derby Tool
- VectorVest Simulator
- VectorVest Variator
- VectorVest Watchdog