

HOT TOPICS LIST
- MACD
- Fibonacci
- RSI
- Gann
- ADXR
- Stochastics
- Volume
- Triangles
- Futures
- Cycles
- Volatility
- ZIGZAG
- MESA
- Retracement
- Aroon
INDICATORS LIST
LIST OF TOPICS
PRINT THIS ARTICLE
by Mark Rivest
See why the 2009 to 2010 rally could forecast the bull market termination point.
Position: N/A
Mark Rivest
Independent investment advisor, trader and writer. He has written articles for Technical Analysis of Stocks & Commodities, Traders.com Advantage,Futuresmag.com and, Finance Magnates. Author of website Four Dimension Trading.
PRINT THIS ARTICLE
ELLIOTT WAVE
Long-term Elliott Wave Perspective For US Stocks
12/30/20 04:03:13 PMby Mark Rivest
See why the 2009 to 2010 rally could forecast the bull market termination point.
Position: N/A
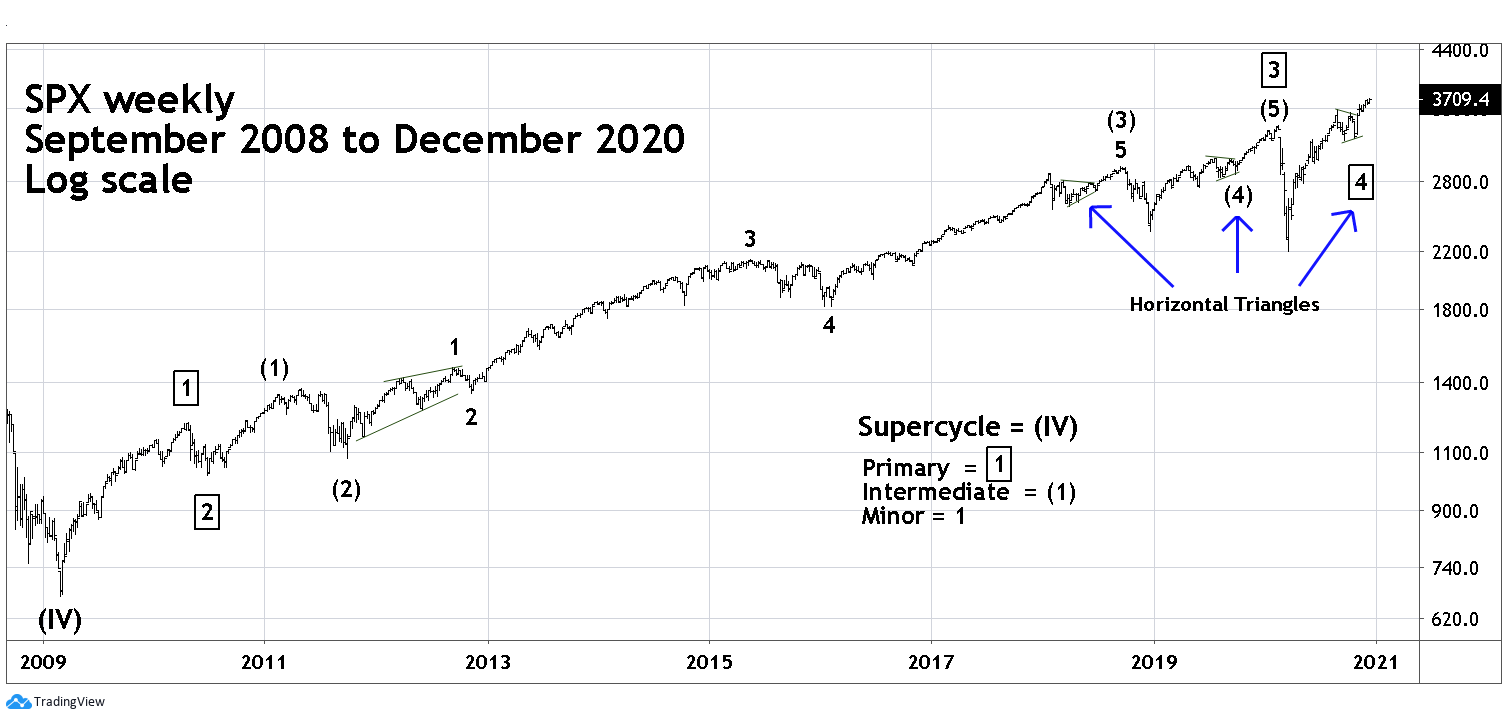
| Knowledge of Elliott Wave patterns can provide tremendous insight as to where, and sometimes when, a market could turn. There are many different Elliott Wave patterns and sub waves can occasionally cloud the bigger picture. Therefore, an analyst must be patient and wait for the pattern to clear. As 2020 ends, tantalizing clues are providing clarity to the long-term Elliott Wave count for US stocks. S&P 500 - Weekly The basic Elliott Wave pattern is five waves of progress followed by three waves of regression. Please see the S&P 500 (SPX) weekly chart illustrated in Figure 1. Since the major bottom made in March 2009, the SPX appears to be in the later portion of an extended five wave pattern. Extensions in stock markets usually appear in the third wave position, note that the supposed Primary wave "3"-boxed subdivides into five intermediate degree waves. Also, Intermediate wave (3) has a clear five wave division. The rally that began in late 2012 and continued into mid-2015 is referred to as a third of a third of a third. This central portion is usually the longest, steadiest and most dynamic part of the entire five wave structure. Another fascinating aspect of the 2009 to 2020 structure is that the peaks made in late 2018 and early 2020 appear to have been preceded by Elliott Wave Horizontal Triangles. Another Horizontal Triangle from the early 2020 top may have completed at the SPX 10/30/20 bottom. |
|
| Figure 1. Extensions in stock markets usually appear in the third wave. |
| Graphic provided by: TradingView. |
| |
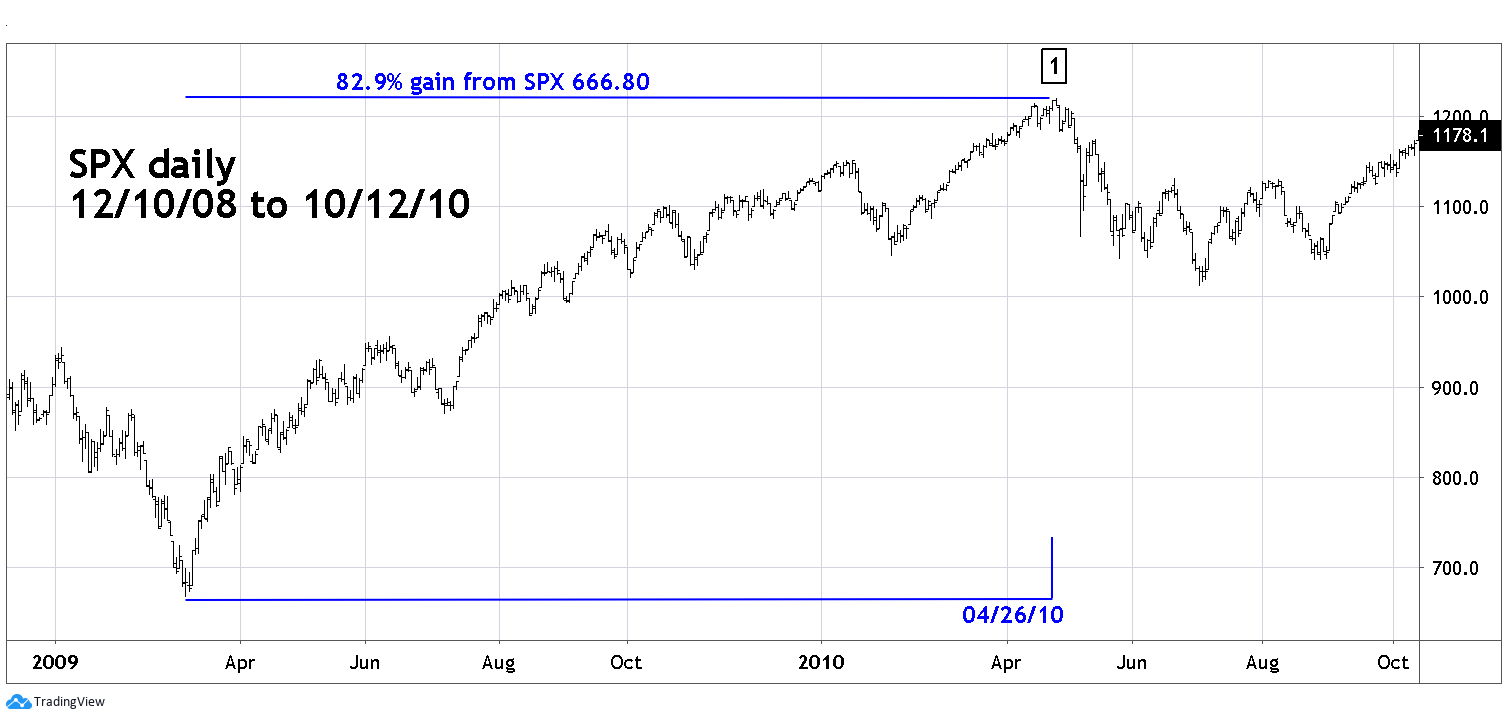
| S&P 500 - Daily - 2009 to 2010 Please see the daily SPX chart 2009 to 2010 illustrated in Figure 2. Within an Elliott five wave impulse pattern, sub wave "one" typically has a Fibonacci relationship with sub wave "five" — usually equality in both price and time. Because there's such a large distance in price between Primary wave "1" and Primary wave "5", growth percentages should be used instead of price. A 100 SPX point move from 700 to 800 is not the same as a 100 point move from 3600 to 3700. The percentage growth of the SPX rally from its March 2009 bottom to the Primary wave "1" top in April 2010 was 82.9% — this is the growth rate to use measuring the rally from the March 2020 bottom. |
|
| Figure 2. The percentage growth of the SPX rally from its March 2009 bottom to the Primary wave "1" top in April 2010 was 82.9%. |
| Graphic provided by: TradingView. |
| |
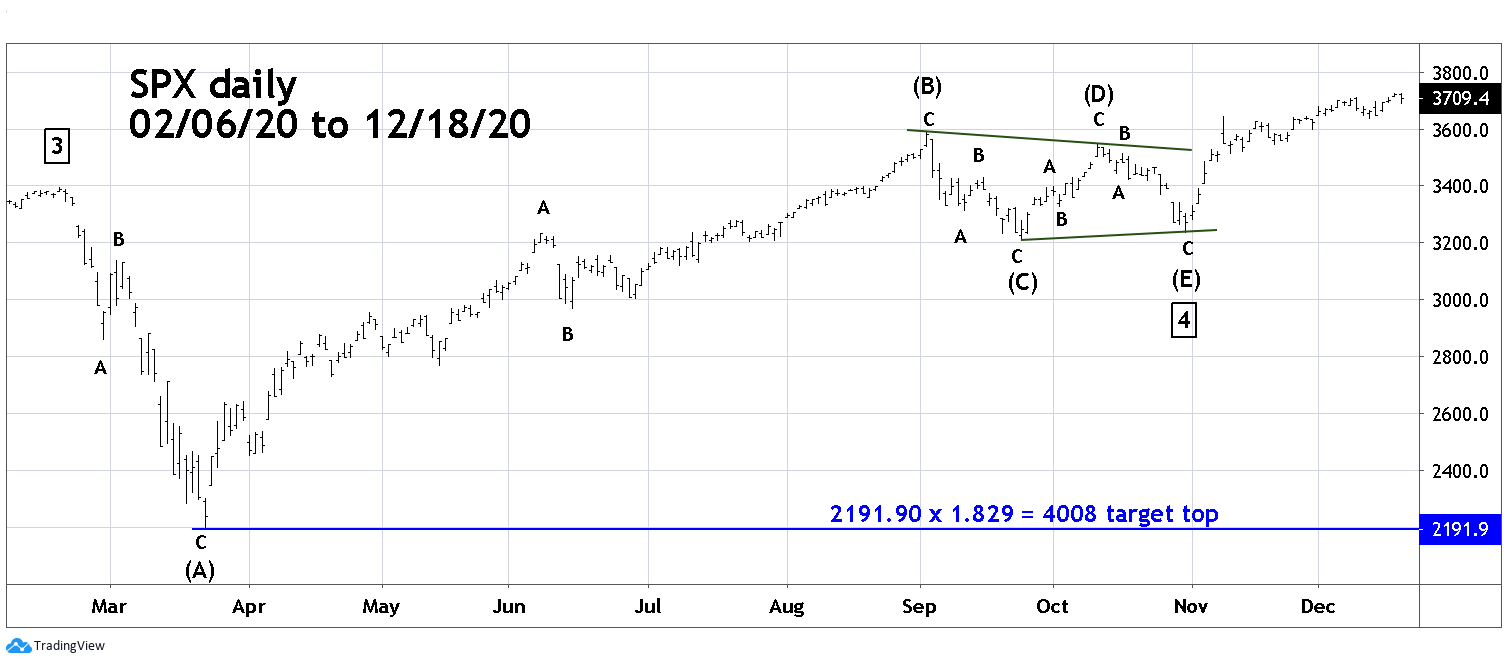
| S&P 500 - Daily - 2020 Please see the daily SPX chart for 2020 illustrated in Figure 3. Horizontal Triangles occur only in the fourth wave position of motive waves and in "B" waves of corrective patterns. They are sideways corrections that are composed of five sub waves, each of which subdivide into three waves or a combination of three waves. For the sake of clarity all of the sub waves of the supposed 2020 Horizontal Triangle are illustrated as Single Zigzags. The supposed Intermediate degree wave (B) can be counted as a Double Zigzag as can the supposed wave (C). A main reason for counting the entire structure from the February 2020 top to the Oct 30 bottom is the rally from wave (A) to wave (B). This structure can't be counted as an Elliott motive wave. Note that the middle portion of this move from mid-May to the peak labeled Minor wave "A" is shorter than the preceding and succeeding moves up. In Elliott wave motive patterns, the third wave can never be the shortest of the three sub motive waves. Usually, the calculation for the post Horizontal Triangle move, in this case Primary wave "5" would be made at the termination point of the Horizontal Triangle. This would be the October 30 bottom labeled wave (E). However, sometimes the calculation can be made at the most extreme point which is wave (A) at the March 23rd bottom. A growth rate 82.9% from SPX 2191.90 targets SPX 4008 for the end point of Primary wave "5". SPX Primary wave "1" lasted 286 trading days, adding this to the 03/23/20 bottom targets 05/11/21 as a potential time in which Primary wave "5" could terminate. Seasonal tops within the last ten years have been occurring late April to early May. |
|
| Figure 3. A growth rate 82.9% from SPX 2191.90 targets SPX 4008 for the end point of Primary wave "5". |
| Graphic provided by: TradingView. |
| |
| Topping Zone If the supposed wave count is correct the SPX is now in Primary wave "5". Could this wave terminate before April 2021 and at a lower price than 4000? Yes, there's no predestination in markets, they are controlled by the mass mind. Individuals can change directions at any point and so can the mass mind. Occasionally, stock markets change direction just before or after a new year. The last time this happened for US stocks was the significant bottom made in late December 2018. The main US stock indices could be vulnerable to a downturn of some degree in the last week of 2020 or the first week of 2021. To all worldwide have a safe and happy holiday season. Further Reading: Frost A.J and Robert Prechter (1985) "Elliott Wave Principle", New Classics Library. |
Independent investment advisor, trader and writer. He has written articles for Technical Analysis of Stocks & Commodities, Traders.com Advantage,Futuresmag.com and, Finance Magnates. Author of website Four Dimension Trading.
| Website: | www.fourdimensiontrading.com |
| E-mail address: | markrivest@gmail.com |
Click here for more information about our publications!
Comments

Request Information From Our Sponsors
- StockCharts.com, Inc.
- Candle Patterns
- Candlestick Charting Explained
- Intermarket Technical Analysis
- John Murphy on Chart Analysis
- John Murphy's Chart Pattern Recognition
- John Murphy's Market Message
- MurphyExplainsMarketAnalysis-Intermarket Analysis
- MurphyExplainsMarketAnalysis-Visual Analysis
- StockCharts.com
- Technical Analysis of the Financial Markets
- The Visual Investor
- VectorVest, Inc.
- Executive Premier Workshop
- One-Day Options Course
- OptionsPro
- Retirement Income Workshop
- Sure-Fire Trading Systems (VectorVest, Inc.)
- Trading as a Business Workshop
- VectorVest 7 EOD
- VectorVest 7 RealTime/IntraDay
- VectorVest AutoTester
- VectorVest Educational Services
- VectorVest OnLine
- VectorVest Options Analyzer
- VectorVest ProGraphics v6.0
- VectorVest ProTrader 7
- VectorVest RealTime Derby Tool
- VectorVest Simulator
- VectorVest Variator
- VectorVest Watchdog