

HOT TOPICS LIST
- MACD
- Fibonacci
- RSI
- Gann
- ADXR
- Stochastics
- Volume
- Triangles
- Futures
- Cycles
- Volatility
- ZIGZAG
- MESA
- Retracement
- Aroon
INDICATORS LIST
LIST OF TOPICS
PRINT THIS ARTICLE
by Mark Rivest
See what message this pattern implies for US stocks.
Position: N/A
Mark Rivest
Independent investment advisor, trader and writer. He has written articles for Technical Analysis of Stocks & Commodities, Traders.com Advantage,Futuresmag.com and, Finance Magnates. Author of website Four Dimension Trading.
PRINT THIS ARTICLE
ELLIOTT WAVE
Elliott - Stock Market - Third Waves
09/11/20 02:45:48 PMby Mark Rivest
See what message this pattern implies for US stocks.
Position: N/A
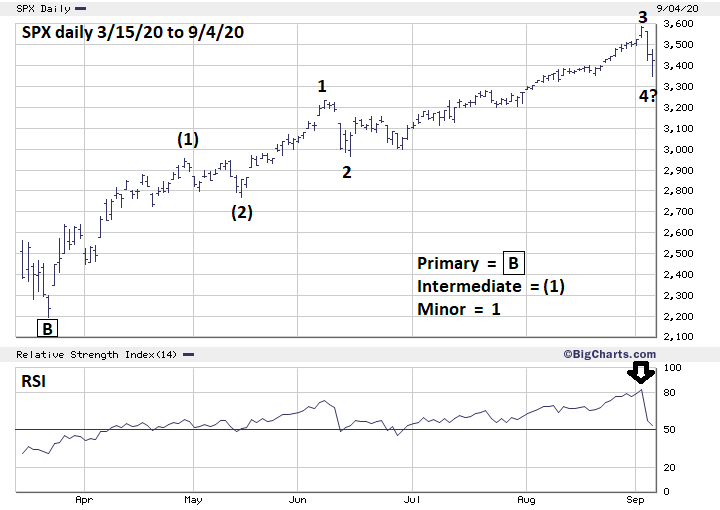
| The S&P 500 (SPX) rally from June to early September 2020 may have been the middle phase of a larger bull move up from the crash bottom made on March 23, 2020. If so, US stocks could continue rising until at least late November 2020. Alternately, there's a lower probable scenario that a major top could be in place. The answer to the markets true path could be discovered in mid-September 2020. S&P 500 - Daily Please see the daily SPX chart illustrated in Figure 1. From the crash bottom to June there were two distinctive declines labeled as Intermediate wave (2) and Minor wave 2. This is referred to in Elliott Wave theory as a series of "ones" and "twos" up, which is the prelude to a long and steady rally. This is exactly what happened from mid-June until early September and is probably the third of a third Elliott wave up. Usually, at least one of the three Elliott motive waves will be extended, meaning you will be able to clearly identify the five divisions of a sub-wave. In stock markets, most of the time the third motive wave is extended. The early September decline appears to be a forming Minor wave "4" of Intermediate wave (3). As of September 8, this drop was nearing equality with the supposed Minor wave "2". Exact equality is at SPX 3320; if this support holds Minor wave "4" could be complete opening the door for the SPX to make additional new all-time highs. |
|
| Figure 1. The early September decline appears to be a forming Minor wave "4" of Intermediate wave (3). |
| Graphic provided by: BigCharts.com. |
| |
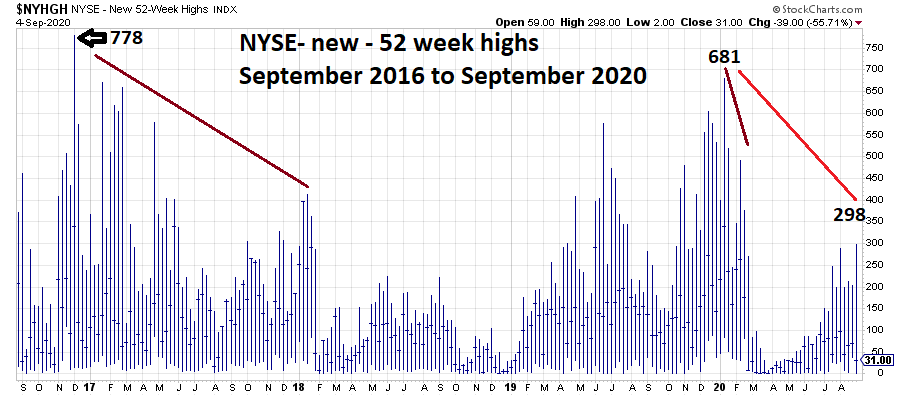
| Momentum Normally within a stock market third of a third up there's a large surge in stocks making new highs. Please see the NYSE New 52-Week highs chart illustrated in Figure 2. This is an update to my December 20, 2019 article "Stock Market Momentum Cycles" which noted that less individual stocks make new highs as a bull market ages. 52-week highs reached 953 in late 2012. In January 2020 new highs were 681. In August 2020 with the SPX higher than it was in January, new highs were only 298. While shockingly low relative to the prior readings, this high point corresponded with the highest SPX price since the rally began on March 23, 2020. This implies the SPX could continue to make new highs as the number of new 52-week highs continues to shrink. However, the very overall low reading could mean something else is happening. |
|
| Figure 2. In August 2020, with the SPX higher than it was in January, new highs were only 298. |
| Graphic provided by: StockCharts.com. |
| |
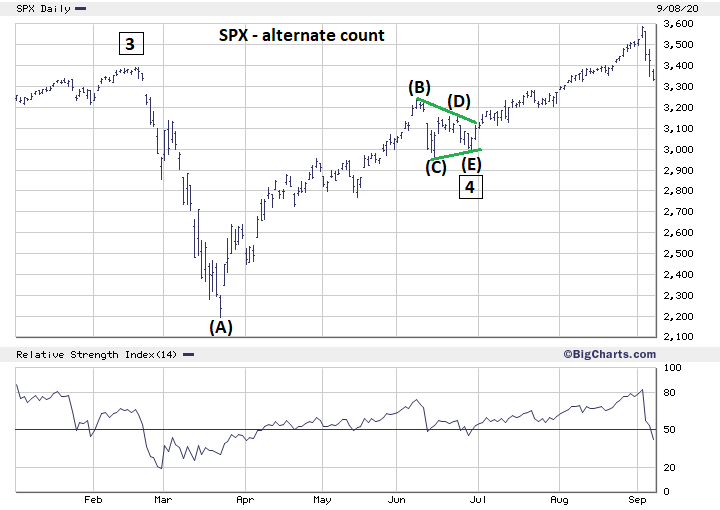
| Alternate Wave Count Please see the daily SPX alternate wave count illustrated in Figure 3. There's no predestination in any market, the mass mind, like an individual mind, can change direction. This alternate count shows that an Elliott Wave Horizontal Triangle may have formed from February 2020 to late June. The flaw with this count is that the supposed Intermediate wave (C) is much smaller than would be expected in this type of pattern. The most important support in this count is a break below SPX 2999 which is the termination point of the supposed Horizontal Triangle. A break of that level could open the door for a move back to the March 2020 crash bottom. |
|
| Figure 3. The most important support in this count is a break below SPX 2999 which is the termination point of the supposed Horizontal Triangle. |
| Graphic provided by: BigCharts.com. |
| |
| Objectivity All traders/investors need to keep an open mind to all possibilities. Elliott Wave price levels can be a great tool to staying objective. If in mid-September the SPX goes below 2999 it could be a major clue of a developing bear market. Further Reading: Frost A.J and Robert Prechter (1985) "Elliott Wave Principle", New Classics Library. |
Independent investment advisor, trader and writer. He has written articles for Technical Analysis of Stocks & Commodities, Traders.com Advantage,Futuresmag.com and, Finance Magnates. Author of website Four Dimension Trading.
| Website: | www.fourdimensiontrading.com |
| E-mail address: | markrivest@gmail.com |
Click here for more information about our publications!
Comments

Request Information From Our Sponsors
- StockCharts.com, Inc.
- Candle Patterns
- Candlestick Charting Explained
- Intermarket Technical Analysis
- John Murphy on Chart Analysis
- John Murphy's Chart Pattern Recognition
- John Murphy's Market Message
- MurphyExplainsMarketAnalysis-Intermarket Analysis
- MurphyExplainsMarketAnalysis-Visual Analysis
- StockCharts.com
- Technical Analysis of the Financial Markets
- The Visual Investor
- VectorVest, Inc.
- Executive Premier Workshop
- One-Day Options Course
- OptionsPro
- Retirement Income Workshop
- Sure-Fire Trading Systems (VectorVest, Inc.)
- Trading as a Business Workshop
- VectorVest 7 EOD
- VectorVest 7 RealTime/IntraDay
- VectorVest AutoTester
- VectorVest Educational Services
- VectorVest OnLine
- VectorVest Options Analyzer
- VectorVest ProGraphics v6.0
- VectorVest ProTrader 7
- VectorVest RealTime Derby Tool
- VectorVest Simulator
- VectorVest Variator
- VectorVest Watchdog