

HOT TOPICS LIST
- MACD
- Fibonacci
- RSI
- Gann
- ADXR
- Stochastics
- Volume
- Triangles
- Futures
- Cycles
- Volatility
- ZIGZAG
- MESA
- Retracement
- Aroon
INDICATORS LIST
LIST OF TOPICS
PRINT THIS ARTICLE
by Mark Rivest
See which stocks are leading the way down in the emerging bear market.
Position: Sell
Mark Rivest
Independent investment advisor, trader and writer. He has written articles for Technical Analysis of Stocks & Commodities, Traders.com Advantage,Futuresmag.com and, Finance Magnates. Author of website Four Dimension Trading.
PRINT THIS ARTICLE
MARKET TIMING
Bear Market Vanguard
08/23/17 05:02:12 PMby Mark Rivest
See which stocks are leading the way down in the emerging bear market.
Position: Sell
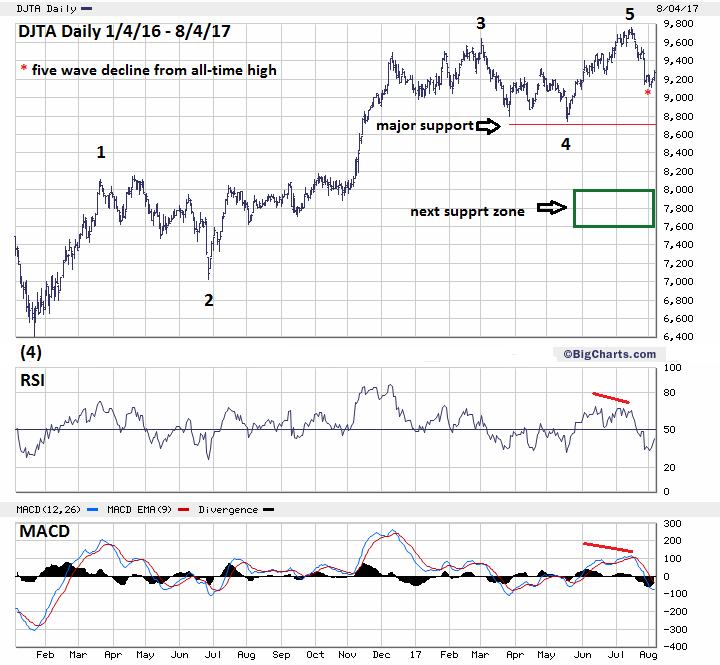
| Usually during the early phase of a stock bull market, the stocks that begin rising first have the greatest chance of producing the largest returns. When a bear market emerges, focus on the weakest stocks, they usually have the greatest profit potential. With overwhelming evidence that a global stock bear market may have begun; transportation, consumer staples and German stocks could provide a hunting ground to find terrific short candidates. Dow Jones Transportation Average (DJTA) For several months, the DJTA has exhibited extremely clear Elliott wave patterns, my July 14 article, "A Ludicrous Non-Confirmation - The Sequel" noted that the DJTA had Fibonacci resistance at 9823.19. Please see the Daily DJTA chart illustrated in Figure 1. On July 14, the DJTA peaked at 9763 just below the broader target zone area of 9800-9830. The subsequent decline was in a clean Elliott five wave pattern, which implies this could be just the first phase of a larger developing bearish pattern. On July 26, there was a Dow Theory non-confirmation signal as the Dow Jones Industrial Average (DJIA) made an all-time high unconfirmed by the DJTA. Since then, the transports have continued to decline as the industrials rallied. If an Elliott five wave pattern from January 2016-July 2017 is complete it implies at least a multi-month decline to the DJTA 7600-8000 areas. A break below the May 18 bottom at 8744.36 will open the door for a move down to 7600-8000. |
|
| Figure 1. A break below the May 18 bottom at 8744.36 will open the door for a move down to 7600�8000. |
| Graphic provided by: BigCharts.com. |
| |
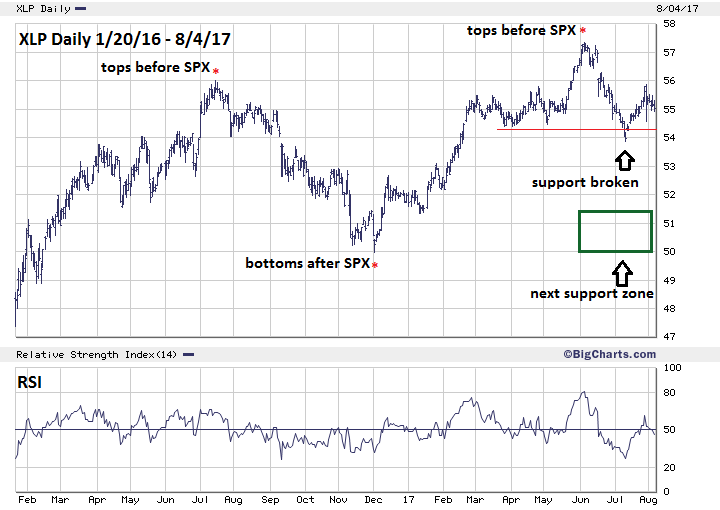
| Consumer Staples Sector (XLP) My June 30 article, "S&P 500 Hits Major Resistance!", noted that the SPDR sector ETF for Consumer Staples, XLP, had probably completed an Elliott five wave rally from the December 2016 bottom. Additionally, from the June 5 top there appeared to be a developing Elliott five wave pattern to the downside. Please see the Daily XLP chart illustrated in Figure 2. Since then the XLP continued to decline in an extended Elliott five waves. Even more important — support at the April 3 bottom of 54.40 has been breached, opening the door to the next support level 50.00-51.50. A fascinating aspect of XLP analysis is that for more than a year it has under-performed the S&P 500 (SPX). The XLP is composed of companies that make essential products. These companies are the bluest of the blue-chip stocks and will normally peak after the main stock indices have terminated their bull runs. This under-performance is a major clue that the next bear market could be severe. |
|
| Figure 2. Even more important, support at the April 3 bottom of 54.40 has been breached, opening the door to the next support level 50.00�51.50. |
| Graphic provided by: BigCharts.com. |
| |
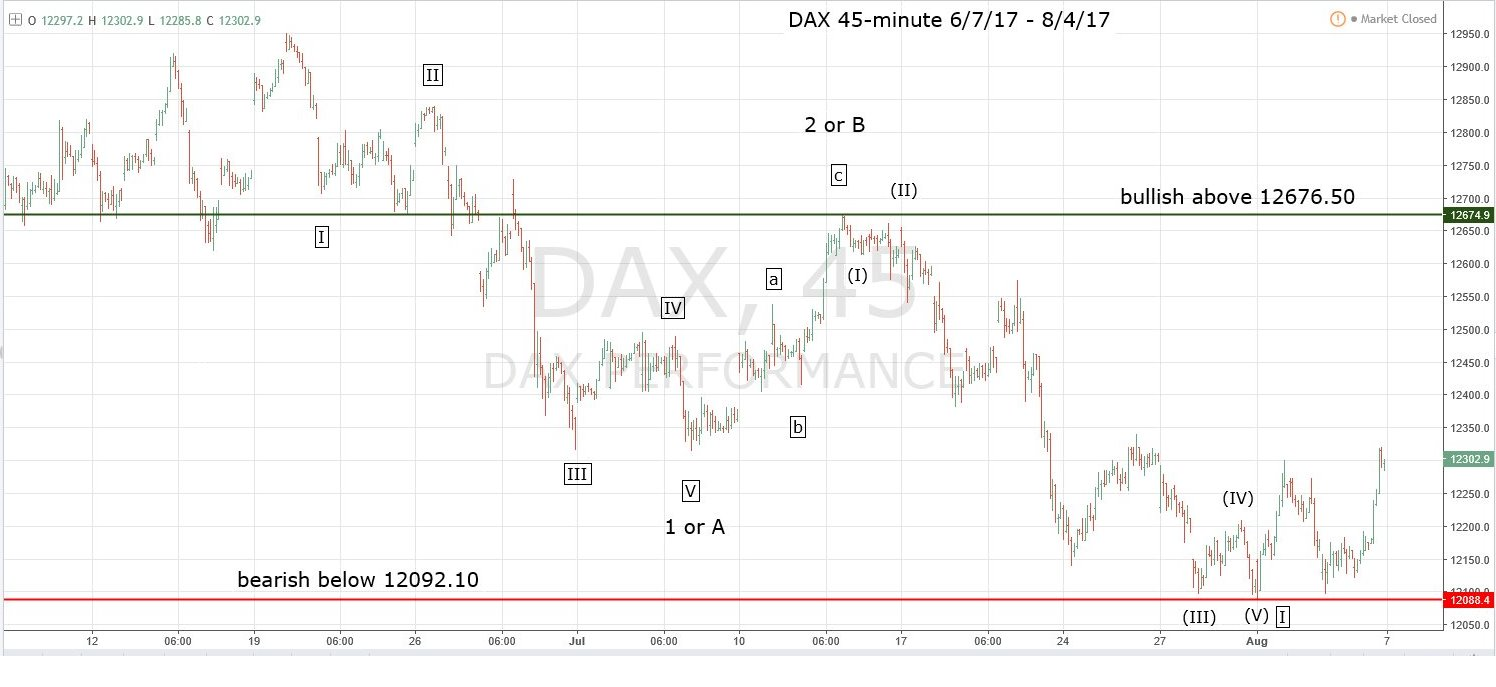
| German DAX My July 26th article "Bearish Divergences Abound" noted that the decline from the June 20 peak had taken the form of a clear Elliott five wave pattern. Additionally, the subsequent rally appeared to be a counter trend three waves and was close to Fibonacci resistance at the .618 area. Please see the DAX 45-Minute chart illustrated in Figure 3. After the July 14 top of 12676.50 made on July 13 which I labeled as "c" boxed, the DAX declined in another Elliott five wave pattern. This could mean that an "A-B-C" corrective pattern is complete or a very bearish series on one's and two's down is developing. Determining which of two possible wave counts could be correct requires evidence from the dimensions of Time, Sentiment and Momentum. The overwhelming bearish evidence that's been gathering for the last several weeks favors the bearish wave count. A series of ones and twos to the downside means an extended five wave Elliott pattern is under development. The subsequent third of a third down is almost always very powerful and dynamic. If this count is correct, it implies the DAX could reach the area 10200 in just a few weeks. This ties in with my analysis of the SPX downside potential noted in my August 3rd article "Amazing Parallels of 2015 and 2017". |
|
| Figure 3. If this count is correct, it implies the DAX could reach the area 10200 in just a few weeks. |
| Graphic provided by: Tradingview.com. |
| |
| Conclusion and Strategy On July 28, 2017, the DJIA made an all-time that was confirmed by nothing. On August 4, 2017, the DJIA made an all-time high confirmed by just the S&P 100 and SPDR Financial Sector fund (XLF). This is more bearish than when the Nasdaq Composite made a ludicrous non-confirmation top in July 2015. The result was a 17% portfolio smashing decline in just over a month. Hold 50% short stocks and use SPX 2510 as a stop loss. If not currently short stocks, get short as soon as possible. If the SPX breaks below 2322.30 increase the short position to 100% and use SPX 2370 as the stop for the second 50%. Many stock are already in a bear market. Watch for downside leaders to short, they could yield tremendous profits in the coming weeks. Further Reading: Frost A.J and Robert Prechter (1985) "Elliott Wave Principle", New Classics Library. |
Independent investment advisor, trader and writer. He has written articles for Technical Analysis of Stocks & Commodities, Traders.com Advantage,Futuresmag.com and, Finance Magnates. Author of website Four Dimension Trading.
| Website: | www.fourdimensiontrading.com |
| E-mail address: | markrivest@gmail.com |
Click here for more information about our publications!
Comments

Request Information From Our Sponsors
- StockCharts.com, Inc.
- Candle Patterns
- Candlestick Charting Explained
- Intermarket Technical Analysis
- John Murphy on Chart Analysis
- John Murphy's Chart Pattern Recognition
- John Murphy's Market Message
- MurphyExplainsMarketAnalysis-Intermarket Analysis
- MurphyExplainsMarketAnalysis-Visual Analysis
- StockCharts.com
- Technical Analysis of the Financial Markets
- The Visual Investor
- VectorVest, Inc.
- Executive Premier Workshop
- One-Day Options Course
- OptionsPro
- Retirement Income Workshop
- Sure-Fire Trading Systems (VectorVest, Inc.)
- Trading as a Business Workshop
- VectorVest 7 EOD
- VectorVest 7 RealTime/IntraDay
- VectorVest AutoTester
- VectorVest Educational Services
- VectorVest OnLine
- VectorVest Options Analyzer
- VectorVest ProGraphics v6.0
- VectorVest ProTrader 7
- VectorVest RealTime Derby Tool
- VectorVest Simulator
- VectorVest Variator
- VectorVest Watchdog