

HOT TOPICS LIST
- MACD
- Fibonacci
- RSI
- Gann
- ADXR
- Stochastics
- Volume
- Triangles
- Futures
- Cycles
- Volatility
- ZIGZAG
- MESA
- Retracement
- Aroon
INDICATORS LIST
LIST OF TOPICS
PRINT THIS ARTICLE
by Mark Rivest
US stocks could decline 15% in one month.
Position: Sell
Mark Rivest
Independent investment advisor, trader and writer. He has written articles for Technical Analysis of Stocks & Commodities, Traders.com Advantage,Futuresmag.com and, Finance Magnates. Author of website Four Dimension Trading.
PRINT THIS ARTICLE
MOMENTUM
Bearish Divergences Abound
07/26/17 05:36:01 PMby Mark Rivest
US stocks could decline 15% in one month.
Position: Sell
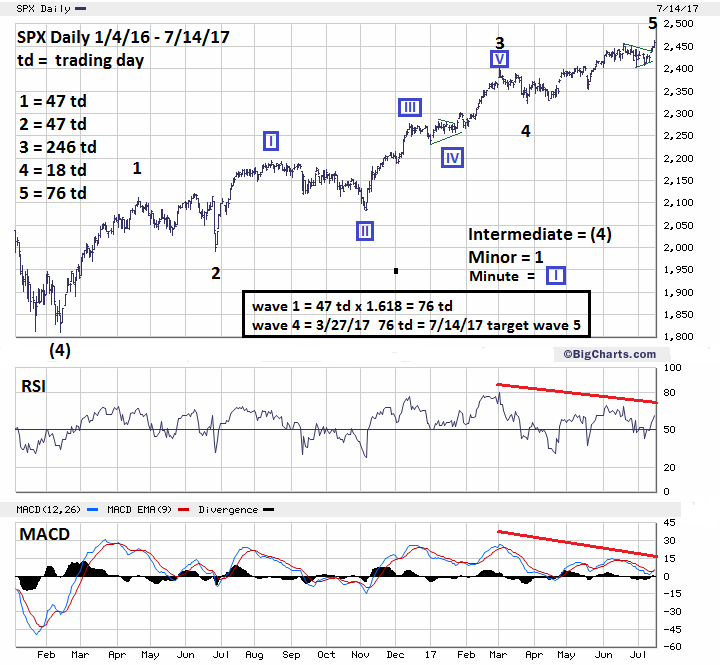
| The US stock market in July 2017 is very much like July 2015. After the Nasdaq Composite (COMP) July 20, 2015 peak it declined 17%, bottoming on August 24. The S&P 500 (SPX) also bottomed on that day, recording a decline of 12% from its high earlier in the year. Overwhelming evidence indicates the US stock market is ripe for a 15% decline into the second half of August 2017. S&P 500 Price and Time Dimensions My last article, "A Ludicrous Non-Confirmation - The Sequel" noted both the Dow Industrial and Transportation averages could make new highs, which has occurred. The SPX has also made a new all-time high, making the bearish divergences slightly less ludicrous. Fibonacci price resistance: My June 30 article "S&P 500 Hits Major Resistance!" noted two major long-term SPX-Fibonacci resistance points at 2454.10 and 2459.30. Subsequently, the SPX appears to have formed an Elliott wave Horizontal Triangle from the peak made on June 19 to July 7. Usually a post triangle trust will equal the widest part of the triangle added to the termination point of the triangle. In this situation, the triangle began at SPX 2453.80 and bottomed at 2405.70 which is 48.10 points. Added to the triangle termination point of 2412.80 targets 2460.90. The SPX high on July 14 was 2463.50 — very close to a tight cluster of three Fibonacci points implies a significant top may have been reached. Please see the daily SPX chart illustrated in Figure 1. There are several methods to discover Fibonacci time cycles. One technique uses numbers in the Fibonacci sequence which is (1, 1, 2, 3, 5 ,8 ,13, 21, 34, to infinity). This method was illustrated in my August 29, 2016 article "Stock Market Lessons from Mr. Fibonacci" and is very precise — there's no allowance for leeway. If, for example, there's a possible market turn after a move of eight trading days, the market must turn on day eight. Turning on day seven or nine would invalidate the method because seven and nine aren't Fibonacci numbers. Another method uses Fibonacci ratios where one market segment has a Fibonacci ratio relationship to another segment. With this technique precision isn't required. In the daily SPX chart, Minor wave "1" is equal 1/1, 47 trading days with Minor wave "2". Leeway is common when using ratios, in most circumstances being close is allowed. For example, 47 trading days to 49 could be considered equal. What's amazing is every Minor wave of the bull move from the February 11, 2016 bottom has perfect Fibonacci ratios. Wave "1" 47td to wave "2" 47td = 1.00 Wave "1" 47td + wave "2" 47td = 94td x 2.618 = 246td of wave "3" Wave "2" 47td x .382 = 18td of wave "4" Wave "1" 47td x 1.618 = 76td of wave "5" This incredible web of Fibonacci relationships by itself is enough evidence to suggest an important top may have been made, but there's much more evidence. |
|
| Figure 1. What�s amazing, every Minor wave of the bull move from the February 11, 2016 bottom has perfect Fibonacci ratios. |
| Graphic provided by: BigCharts.com. |
| |
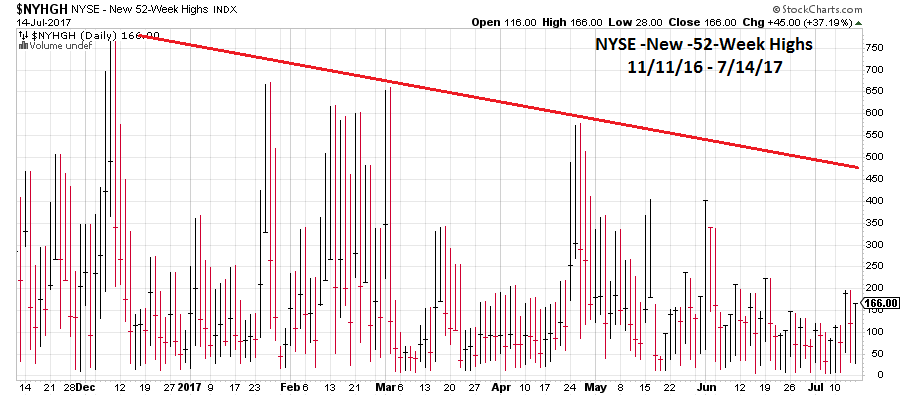
| Momentum Dimension Please see the "NYSE - 52-week new highs" chart illustrated in Figure 2. From December 2016, the number of stocks making new highs on the NYSE has declined an incredible 78%! Even more amazing, the SPX on July 14 rose more than 11 points yet still recorded less new highs than the day before! A case could be made that most stocks on the NYSE are already in a bear market. Two of the nine SPDR sector funds confirmed the new highs made in the SPX and Dow Jones Industrial Average (DJIA). This is up from zero that confirmed the DJIA high made last week. While slightly more bullish this is still less than the five SPDR sector funds that confirmed the COMP high made on July 20, 2015. |
|
| Figure 2. From December 2016, the number of stocks making new highs on the NYSE has declined an incredible 78%! |
| Graphic provided by: StockCharts.com. |
| |
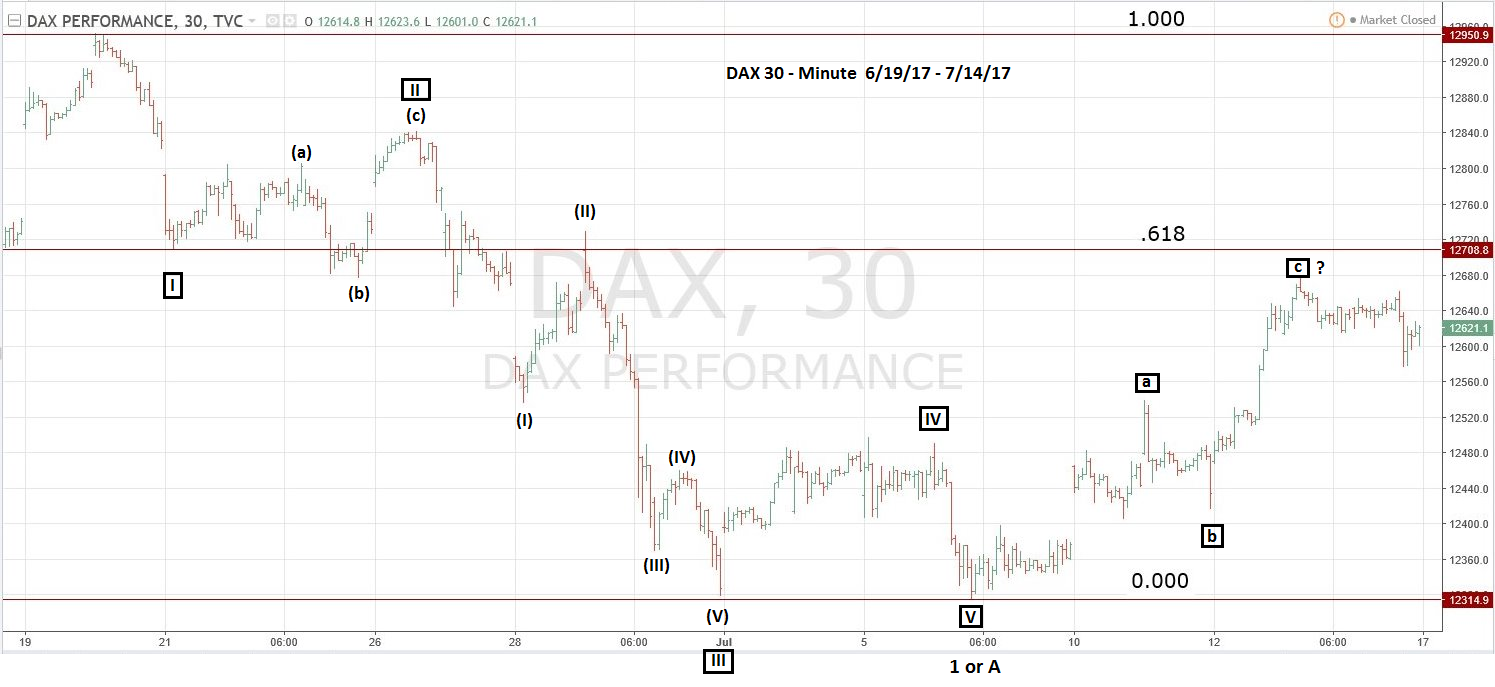
| National Stock Markets My April 21st article "Global Non-Confirmation" examined several national stock markets that had bearish divergences with US stock indices. Narrowing the focus to the five major national stock indices reveals that the bearish divergences with the US stock market have increased. Japan - Nikkei 225 China - Shanghai Composite Hong Kong - Hang Seng United Kingdom - FTSE 100 Germany - DAX Japan, China and Hong Kong stock indices are still significantly below their last important peaks made in 2015. In January 2017, the FTSE exceeded its 2015 peak and made new highs until June. The DAX exceeded its 2015 in April 2017 and made new highs until June. Please see the 30-minute DAX chart illustrated in Figure 3. Since the DAX peak made on June 20, the decline has taken the form of a clear Elliott five wave pattern. The subsequent rally appears to be a counter trend three waves and is close to Fibonacci resistance at the .618 area. This implies one of the major national stock indices that had been able to confirm new US highs is about to begin a new down wave. |
|
| Figure 3. Since the DAX peak made on June 20 the decline has taken the form of a clear Elliott five wave pattern. |
| Graphic provided by: Tradingview.com. |
| |
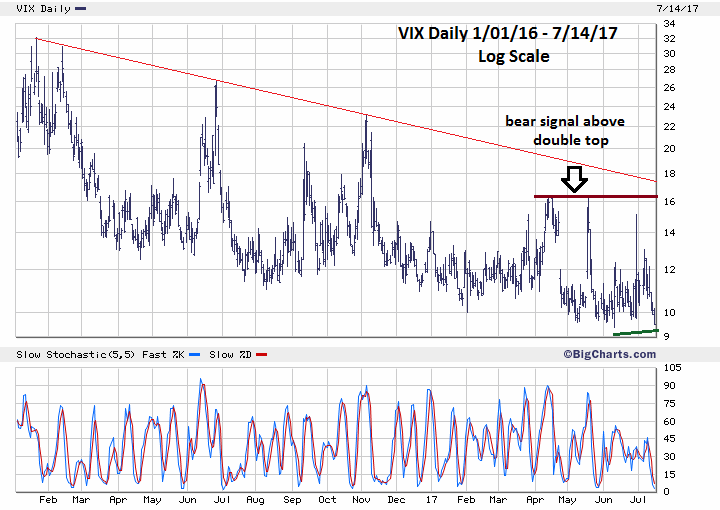
| Sentiment Dimension Please see the daily VIX chart illustrated in Figure 4. Several of my articles have noted that when the VIX makes a new low it is bullish for the SPX. On July 14, VIX reached 9.50, above the 2017 low of 9.37. With the SPX making a new high on the 14th, this is a bearish divergence signal. If the VIX goes below 9.37 it could lead to a new SPX high. |
|
| Figure 4. With the SPX making a new high on the 14th this is a bearish divergence signal. |
| Graphic provided by: BigCharts.com. |
| |
| Summary and Strategy The evidence of a significant and imminent stock market top is overwhelming. The last time conditions were this bearish was July 2015, just prior to a 12% SPX decline and a 17% COMP fall. In the next several weeks, SPX could decline into the area of the early November 2016 low. Hold 50% stocks and use SPX 2510 as a stop loss. If not currently short, get short 50% stocks as soon as possible. Most stocks are already in a bear market. The best chance for traders to profit is by embracing the bear. Traders that fight the bear in the next several weeks are likely to get mauled. Further Reading: Frost A.J and Robert Prechter (1985) "Elliott Wave Principle", New Classics Library. Prechter Jr. R. Robert (2003) "Beautiful Pictures", New Classics Library. |
Independent investment advisor, trader and writer. He has written articles for Technical Analysis of Stocks & Commodities, Traders.com Advantage,Futuresmag.com and, Finance Magnates. Author of website Four Dimension Trading.
| Website: | www.fourdimensiontrading.com |
| E-mail address: | markrivest@gmail.com |
Click here for more information about our publications!
Comments

Request Information From Our Sponsors
- StockCharts.com, Inc.
- Candle Patterns
- Candlestick Charting Explained
- Intermarket Technical Analysis
- John Murphy on Chart Analysis
- John Murphy's Chart Pattern Recognition
- John Murphy's Market Message
- MurphyExplainsMarketAnalysis-Intermarket Analysis
- MurphyExplainsMarketAnalysis-Visual Analysis
- StockCharts.com
- Technical Analysis of the Financial Markets
- The Visual Investor
- VectorVest, Inc.
- Executive Premier Workshop
- One-Day Options Course
- OptionsPro
- Retirement Income Workshop
- Sure-Fire Trading Systems (VectorVest, Inc.)
- Trading as a Business Workshop
- VectorVest 7 EOD
- VectorVest 7 RealTime/IntraDay
- VectorVest AutoTester
- VectorVest Educational Services
- VectorVest OnLine
- VectorVest Options Analyzer
- VectorVest ProGraphics v6.0
- VectorVest ProTrader 7
- VectorVest RealTime Derby Tool
- VectorVest Simulator
- VectorVest Variator
- VectorVest Watchdog