

HOT TOPICS LIST
- MACD
- Fibonacci
- RSI
- Gann
- ADXR
- Stochastics
- Volume
- Triangles
- Futures
- Cycles
- Volatility
- ZIGZAG
- MESA
- Retracement
- Aroon
INDICATORS LIST
LIST OF TOPICS
PRINT THIS ARTICLE
by Mark Rivest
The crowd is focused on Dow 20,000. Find out the real number to watch.
Position: Sell
Mark Rivest
Independent investment advisor, trader and writer. He has written articles for Technical Analysis of Stocks & Commodities, Traders.com Advantage,Futuresmag.com and, Finance Magnates. Author of website Four Dimension Trading.
PRINT THIS ARTICLE
ELLIOTT WAVE
Dow 20,000 - The Elusive Nirvana
01/11/17 04:30:42 PMby Mark Rivest
The crowd is focused on Dow 20,000. Find out the real number to watch.
Position: Sell
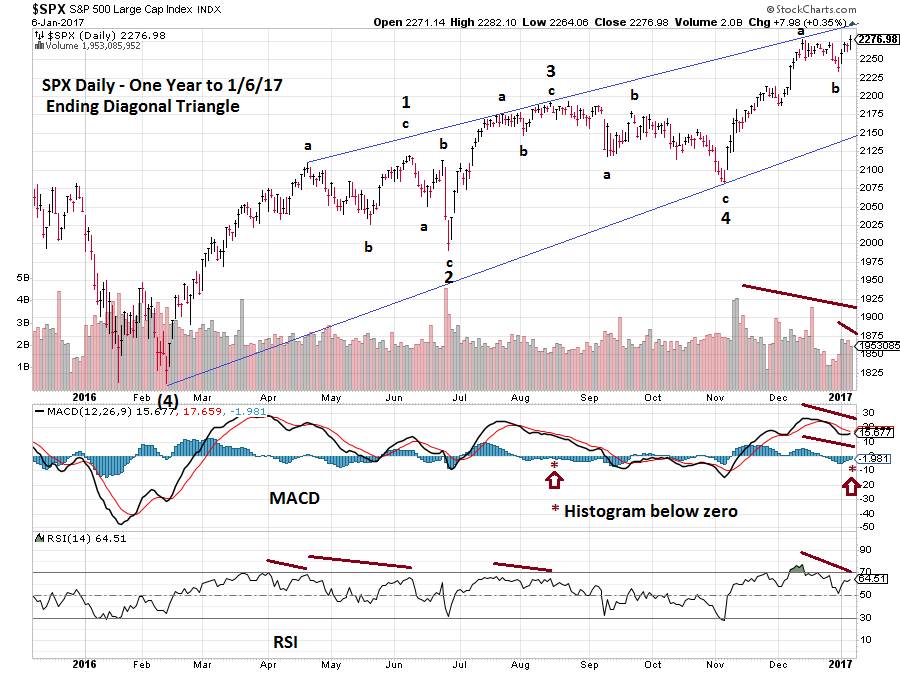
| The last week of 2016, stock market bears began to make progress only to be quickly pushed back by the relentless bulls. The crowd fascination with the Dow Jones Industrial Average (DJIA) reaching 20,000 could be misplaced and another sign that the global stock market could be on the verge of a significant decline. S&P 500 — One Year My last article "Say Goodbye To 20,000" noted the S&P 500 (SPX) bottom on December 30, 2016, was near three Fibonacci coordinates and strongly implied a rally had begun. Based on how the SPX rallies in the last few days of 2016 quickly ended, the new rally was not expected to last very long. The bulls had something else in mind and pushed stocks up the entire week. Please see the daily SPX chart illustrated in Figure 1. This is an update to the SPX chart illustrated in my December 20th article "Stock Market Bears Hold the One Yard Line". Since the February 11, 2016 bottom the SPX appears to be forming an Elliott wave Ending Diagonal Triangle. This is a termination pattern of the larger trend and each of its five waves subdivided into three wave structures. Most importantly, the third wave of the pattern can never be the shortest, in this case the supposed wave "5" from November 4th cannot exceed SPX 2285.92. A move above this level is bullish and implies the SPX could rally for several more weeks before topping out. SPX 2285.92, not DJIA 20,000, is the important number to focus on. When the SPX moved to an all-time high on January 6th it registered several bearish signals. RSI recorded a bearish divergence vs. the SPX December 13th top. Most of the time stock indices will hit peaks with RSI bearish divergences. Note the three other instances in 2016 when the SPX made peaks with a bearish RSI divergence. Daily MACD lines have a bearish divergence, MACD histogram has a double bearish divergence and below the zero line which is exceptionally bearish. Volume for each trading day of the new year was below the levels recorded on the rally November 4-December 13. The volume on January 6th, with the SPX making an all-time high, was the lowest of the week — very curious considering all the excitement of the DJIA nearing 20,000. There's enough evidence on this one chart to strongly suggests the SPX is on the verge of a significant decline. But wait, there's more! |
|
| Figure 1. Daily MACD lines have a bearish divergence. MACD histogram has a double bearish divergence and below the zero line, which is exceptionally bearish. |
| Graphic provided by: StockCharts.com. |
| |
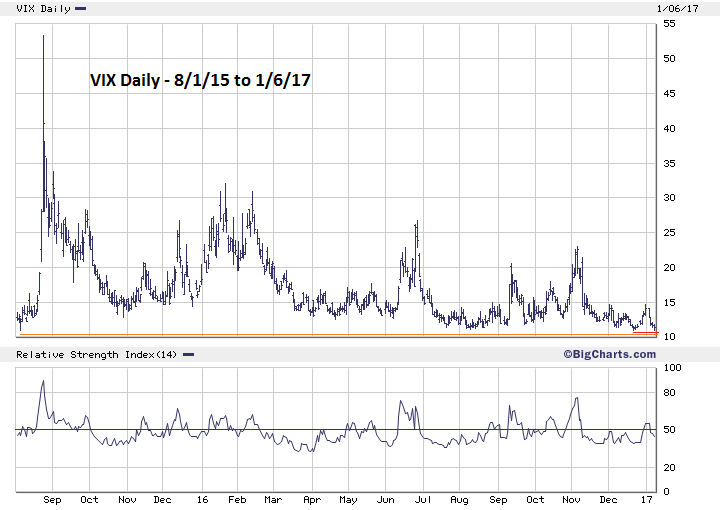
| Sentiment Dimension My December 28th article "Trading The Cusp Of A New Year" noted the VIX almost always needs to register a higher low vs. an SPX higher high to indicate a SPX top. Please see the daily VIX chart illustrated in Figure 2. On January 6th, VIX hit a low of 10.98 above the low of 10.93 made on December 21, 2016. Also, the VIX is still above, and in the area, it was at on August 5, 2015, which was two weeks before the mini crash. The Market Vane Bullish Consensus reading for the week of January 3rd was 63% — near the reading made in mid-May 2015 at the time of the SPX intermediate top. Finally, there's anecdotal evidence of excessive bullishness toward stocks. Traders on the floor of the NYSE wearing 20,000 hats. TV Financial news shows on DJIA 20,000 alert. Even the non-financial news media is joining the DJIA 20,000 party. The anecdotal evidence is a sign of complacency. The crowd is ignoring the risks of holding and buying stocks in early 2017. |
|
| Figure 2. On January 6th, VIX hit a low of 10.98, above the low of 10.93 made on December 21, 2016. |
| Graphic provided by: BigCharts.com. |
| |
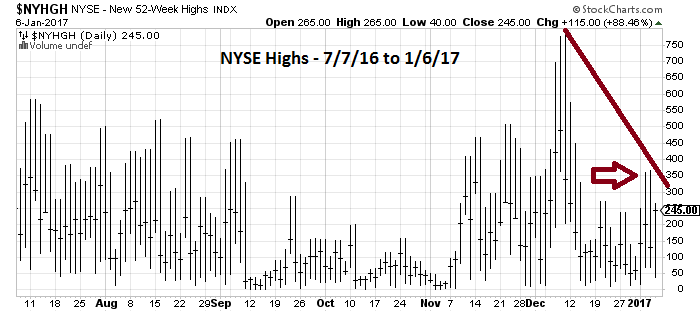
| NYSE — New Highs Please see the NYSE — New 52-Week high chart illustrated in Figure 3. Why aren't NYSE floor traders wearing NYSE 265 hats? What's 265? That's the number of NYSE stocks that made new 52-week highs on January 6th. Well below the 778 new highs recorded on December 9th. Even more shocking, on the day the DJIA was closing in on 20,000, NYSE new highs were below even the intraday levels recorded on January 4th (361) and January 5th (368). Apparently, the average shareholder wasn't invited to the DJIA 20,000 party — their portfolios aren't rising. |
|
| Figure 3. Apparently, the average shareholder wasn�t invited to the DJIA 20,000 party — their portfolios aren�t rising. |
| Graphic provided by: StockCharts.com. |
| |
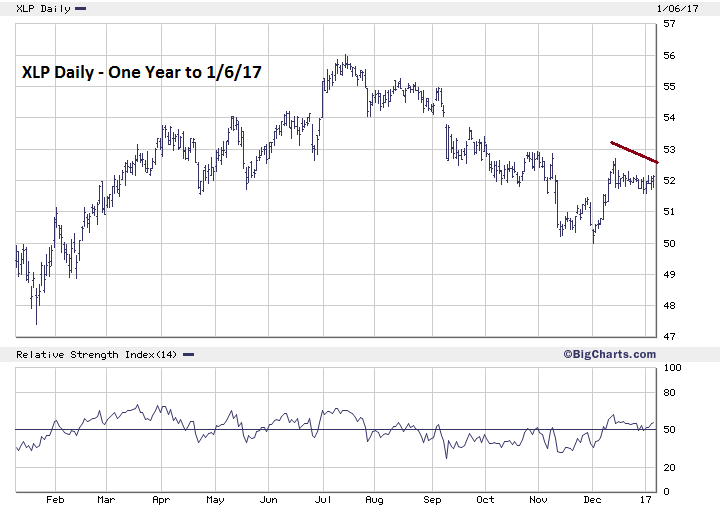
| Sector Analysis My December 14th article "Bull Run" noted that the Consumer Staples sector ETF (XLP) had finally exhibited evidence of a short-term bottom. Please see the daily XLP chart illustrated in Figure 4. The rally ended on December 14th, and with all three of the main US stock indices at higher highs on January 6th, XLP is lagging. Only the Technology sector ETF (XLK) is showing a new high. The other seven SPX sector EFTs failed to confirm the highs made in the three main US stock indices. Some analysts are calling this healthy sector rotation. They could be half right, there could be rotation taking place, not between sectors but between classes. Rotation out of the asset class of stocks and into cash. |
|
| Figure 4. The XLP rally ended on December 14th, and with all three of the main US stock indices at higher highs on January 6th, XLP is lagging. |
| Graphic provided by: BigCharts.com. |
| |
| Summary and Strategy There were two bullish factors in the first week of 2017 trading: 1. All three main US stock indices made new highs. Typically, significant tops have at least one divergence. 2. Stock market rallies in the first week of the year usually set the tone for the month and year. These were offset by two bearish factors, SPX daily RSI and Volume bearish divergences. The balance of technical evidence remains overwhelmingly bearish. Reiterating, if the SPX has not traded above 2285.92, short 50% as soon as possible and use SPX 2285.93 as the stop loss. If still holding long positions, early January could be the last time to liquidate at the most advantageous prices. If a top is forming, the crowd celebration of Dow 20,000 could be akin to an event 105 years ago — that of passengers boarding the Titanic. Further Reading: Frost A.J and Robert Prechter (1985) "Elliott Wave Principle", New Classics Library. |
Independent investment advisor, trader and writer. He has written articles for Technical Analysis of Stocks & Commodities, Traders.com Advantage,Futuresmag.com and, Finance Magnates. Author of website Four Dimension Trading.
| Website: | www.fourdimensiontrading.com |
| E-mail address: | markrivest@gmail.com |
Click here for more information about our publications!
PRINT THIS ARTICLE

Request Information From Our Sponsors
- StockCharts.com, Inc.
- Candle Patterns
- Candlestick Charting Explained
- Intermarket Technical Analysis
- John Murphy on Chart Analysis
- John Murphy's Chart Pattern Recognition
- John Murphy's Market Message
- MurphyExplainsMarketAnalysis-Intermarket Analysis
- MurphyExplainsMarketAnalysis-Visual Analysis
- StockCharts.com
- Technical Analysis of the Financial Markets
- The Visual Investor
- VectorVest, Inc.
- Executive Premier Workshop
- One-Day Options Course
- OptionsPro
- Retirement Income Workshop
- Sure-Fire Trading Systems (VectorVest, Inc.)
- Trading as a Business Workshop
- VectorVest 7 EOD
- VectorVest 7 RealTime/IntraDay
- VectorVest AutoTester
- VectorVest Educational Services
- VectorVest OnLine
- VectorVest Options Analyzer
- VectorVest ProGraphics v6.0
- VectorVest ProTrader 7
- VectorVest RealTime Derby Tool
- VectorVest Simulator
- VectorVest Variator
- VectorVest Watchdog