HOT TOPICS LIST
- MACD
- Fibonacci
- RSI
- Gann
- ADXR
- Stochastics
- Volume
- Triangles
- Futures
- Cycles
- Volatility
- ZIGZAG
- MESA
- Retracement
- Aroon
INDICATORS LIST
LIST OF TOPICS
PRINT THIS ARTICLE
by Mark Rivest
The end of 2016 tells us why we may not see Dow Jones Industrial Average 20,000 for several months.
Position: Sell
Mark Rivest
Independent investment advisor, trader and writer. He has written articles for Technical Analysis of Stocks & Commodities, Traders.com Advantage,Futuresmag.com and, Finance Magnates. Author of website Four Dimension Trading.
PRINT THIS ARTICLE
FIBONACCI
Say Goodbye to 20,000
01/04/17 03:28:16 PMby Mark Rivest
The end of 2016 tells us why we may not see Dow Jones Industrial Average 20,000 for several months.
Position: Sell
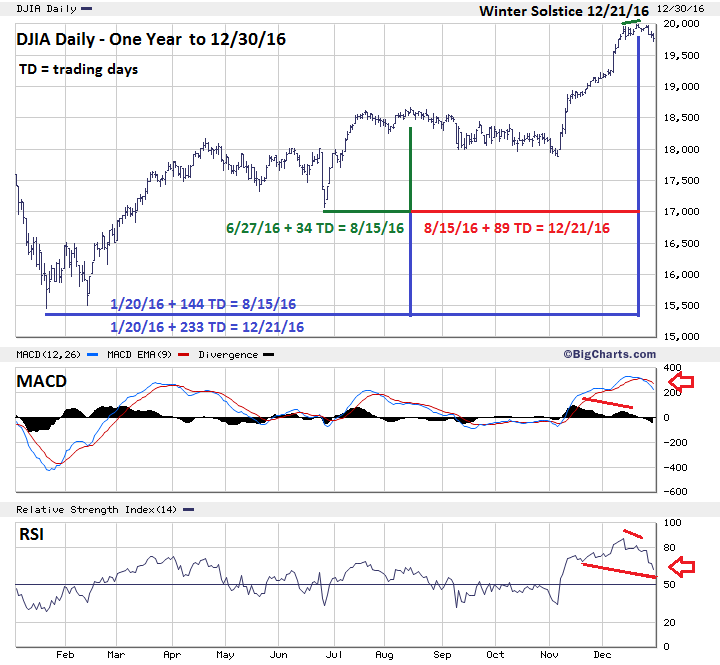
| The stock market's last week of the year is usually boring, with low volume and narrow trading range. The end of 2016 is different because additional evidence has emerged indicating a significant decline may have begun. Dow Jones Industrial Average — One Year On December 13th — a full moon — the S&P 500 (SPX) rally from February 11, 2016 was the same number of calendar days as the rally from July 2010 to May 2011. Please see my December 20th article "Stock Market Bears Hold the One Yard Line." On December 21st Winter Solstice, the Dow Jones Industrial Average (DJIA) had its chance for a significant time cycle turn. Please see the daily DJIA chart illustrated in Figure 1. In my July 8th article "The Brexit Factor — Part Two" I noted that since April 20th the SPX has been moving in time segments related to the Fibonacci sequence (1 ,1, 2, 3, 5, 8, 13, 21, 34, 55, 89, 144, 233, to infinity). Amazingly, the DJIA is still moving within this incredible Fibonacci web. This recent example is the most elegant of all. The entire bull move from January 20th to December 21st forms a Fibonacci Golden section with the intermediate peak on August 15th as the nexus. Truly a work of art! The Golden section and its size imply this turn is more significant than any of the prior 2016 Fibonacci time cycle turns. If the December 21st top holds, this formation will be illustrated in future Technical Analysis books as a perfect example of how to use Fibonacci time cycles. There are also bearish momentum signals. The DJIA closing high of December 20th had a bearish RSI divergence with the reading made December 13th. Also, note the RSI has broken below the level it recorded on November 18th. Sometimes when the RSI breaks below or above a level it can have predictive value. In this case, it's predicting the DJIA could soon be trading at the level it was at on November 18th — around 18860. The MACD histogram had a bearish divergence vs. the November peak and the lines have a bearish cross over. Incredibly, there is more bearish momentum evidence, both the DJIA and SPX failed to confirm the Nasdaq Composite new all-time high recorded on December 27th, one day before a new moon. |

|
| Figure 1. The Golden section and its size imply this turn is more significant than any of the prior 2016 Fibonacci time cycle turns. |
| Graphic provided by: BigCharts.com. |
| |
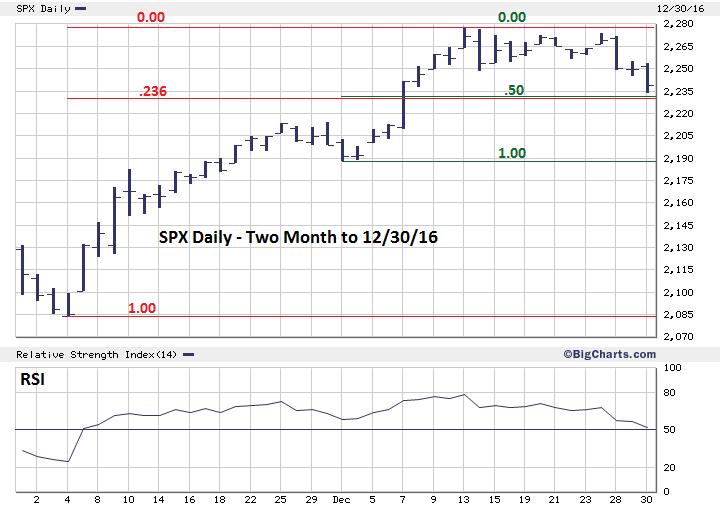
| S&P 500 — Two Month Some bullish evidence appeared in late 2016. Please see the SPX—Two Month chart illustrated in Figure 2. The SPX low on December 30th at 2233.60 came near three Fibonacci coordinates. A .236 retrace of the rally from November 3rd is at 2231.80. A .50 retrace of the rally from December 1st is at 2232.40. The third coordinate comes from the relationship between two declines. The December 27-30 decline was 40.20 points. The December 13-14 drop was 29.10 points. 40.20/29.10 = 1.381 — a near perfect 1.382 Fibonacci relation. There are also intraday bullish momentum divergences at the 2233.60 bottom. Three Fibonacci coordinates near a bottom is bullish and strongly implies a rally has begun. However, if we drill down to the intraday level, characteristics of recent trading days hint the next rally could be short lived. |

|
| Figure 2. The SPX low on December 30th at 2233.60 came near three Fibonacci coordinates. |
| Graphic provided by: BigCharts.com. |
| |
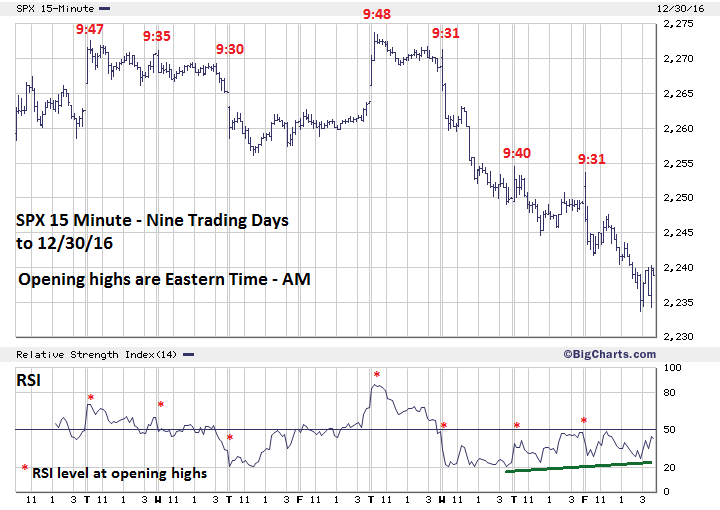
| S&P 500 — Nine Trading Day Most of the time when stock indices such as the SPX are in a bull market, the low of the day is made at or near the open. In bear markets the high of the day is at or near the open. Please see the SPX — 15 Minute chart illustrated in Figure 3. Seven out of the last nine trading days the SPX has made the high of the day soon after the open. The longest opening rally of the seven days was eighteen minutes. Of note is the last three trading days of 2016. The declines began with the 15-minute RSI below 50%. The bears are attacking quickly, not even waiting for the momentum to rise above neutral readings. |

|
| Figure 3. The bears are attacking quickly, not even waiting for the momentum to rise above neutral readings. |
| Graphic provided by: BigCharts.com. |
| |
| Summary and Strategy My last article "Trading the Cusp Of A New Year" noted that the weight of the technical evidence for the stock market was overwhelmingly bearish. The new evidence just one week later is again heavily in favor of the bears. Perhaps the evidence last week was skewed because trading was light or funds and indices had year-end reallocations. But the evidence has been gathering for weeks, and some evidence goes back several months when three of the SPX main sectors began to lag the broader market. The bulls would need to push above the last significant intra-day high of 2273.80 to regain the momentum. A breach of this level would open the door to attack very important resistance at 2285.92. Allowing for leeway of five points below the Fibonacci cluster in the low 2230 area, if the bears break below SPX 2227 it could fall, in a few hours, at least twenty points. This would probably be just the start of a much larger decline. Reiterating, if the SPX has not traded above SPX 2285.92, short 50% as soon as possible and use SPX 2285.93 as the stop loss. If still holding long positions, early January could be the last time to liquidate at the most advantageous prices. At the dawn of a new year it looks like the bear is out of its cage and hungry. Further Reading: Frost A.J and Robert Prechter (1985) "Elliott Wave Principle", New Classics Library. |
Independent investment advisor, trader and writer. He has written articles for Technical Analysis of Stocks & Commodities, Traders.com Advantage,Futuresmag.com and, Finance Magnates. Author of website Four Dimension Trading.
| Website: | www.fourdimensiontrading.com |
| E-mail address: | markrivest@gmail.com |
Click here for more information about our publications!
PRINT THIS ARTICLE

Request Information From Our Sponsors
- StockCharts.com, Inc.
- Candle Patterns
- Candlestick Charting Explained
- Intermarket Technical Analysis
- John Murphy on Chart Analysis
- John Murphy's Chart Pattern Recognition
- John Murphy's Market Message
- MurphyExplainsMarketAnalysis-Intermarket Analysis
- MurphyExplainsMarketAnalysis-Visual Analysis
- StockCharts.com
- Technical Analysis of the Financial Markets
- The Visual Investor
- VectorVest, Inc.
- Executive Premier Workshop
- One-Day Options Course
- OptionsPro
- Retirement Income Workshop
- Sure-Fire Trading Systems (VectorVest, Inc.)
- Trading as a Business Workshop
- VectorVest 7 EOD
- VectorVest 7 RealTime/IntraDay
- VectorVest AutoTester
- VectorVest Educational Services
- VectorVest OnLine
- VectorVest Options Analyzer
- VectorVest ProGraphics v6.0
- VectorVest ProTrader 7
- VectorVest RealTime Derby Tool
- VectorVest Simulator
- VectorVest Variator
- VectorVest Watchdog
