

HOT TOPICS LIST
- MACD
- Fibonacci
- RSI
- Gann
- ADXR
- Stochastics
- Volume
- Triangles
- Futures
- Cycles
- Volatility
- ZIGZAG
- MESA
- Retracement
- Aroon
INDICATORS LIST
LIST OF TOPICS
PRINT THIS ARTICLE
by Mark Rivest
See why the stock market in October 2016 is eerily like August 2015.
Position: Sell
Mark Rivest
Independent investment advisor, trader and writer. He has written articles for Technical Analysis of Stocks & Commodities, Traders.com Advantage,Futuresmag.com and, Finance Magnates. Author of website Four Dimension Trading.
PRINT THIS ARTICLE
MARKET TIMING
Stock Market Mini Crash - 2016
11/02/16 04:36:52 PMby Mark Rivest
See why the stock market in October 2016 is eerily like August 2015.
Position: Sell
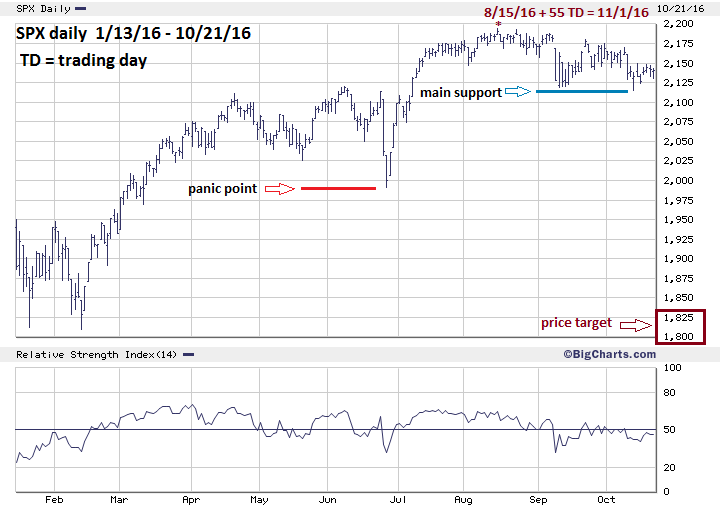
| After reaching a major Fibonacci resistance area on August 15, 2016 the S&P 500 (SPX) has been meandering in a narrow range — which looks very much like what happened in 2015 after the SPX reached a major resistance area on May, 20, 2015. What resulted after the 2015 peak was the August mini crash. Could there be another similar sharp decline? S&P 500 – 2016 Price charts of any market are like a battlefield map, bulls and bears have strategic points they must hold. Please see my May 27, 2015 article "The Battlefield" for an in-depth discussion of the subject. Please see the daily 2016 SPX chart illustrated in Figure 1. The August 15th top support is clearly defined in the SPX 2114 to 2119 area. This is a logical zone for the SPX to find support because it brackets a 38% retracement of the rally from the Brexit bottom at 1991 and the high of the year at 2193. The bulls-eye target is SPX 2116.60. If the 2114 bottom is breached, the next logical support area is the very important Brexit bottom at 1991. If the low of 1991 is broken there is no significant chart support until the double bottom of SPX 1812-1810 made in January and February. There's additional Fibonacci evidence to suggest an important bottom in the low 1800 area. Please see the weekly SPX chart illustrated in my October 14, 2016 article "How to Find Major Turns in Any Market". This chart illustrates a possible extended five wave Elliott pattern under development from the March 2009 bottom. Note the first significant decline of 17.1% after the 2009 -2010 rally. In Elliott wave hierarchy, this is a Primary degree wave and is labeled as wave "2 boxed". If the current decline from August 15th is part of a still developing five wave pattern, then it could be Primary wave "4 boxed". A common Fibonacci relationship between waves "2" and "4" is equality. A 17.1% decline from the SPX high of the year targets 1818 very close to the January - February double bottom. Assuming the SPX bottom at 2114 is broken why should we expect the very important Brexit bottom made on June 27th to be breeched? The answer is found in market momentum. |
|
| Figure 1. Since the August 15th top support is clearly defined in the SPX 2114 to 2119 area. |
| Graphic provided by: BigCharts.com. |
| |
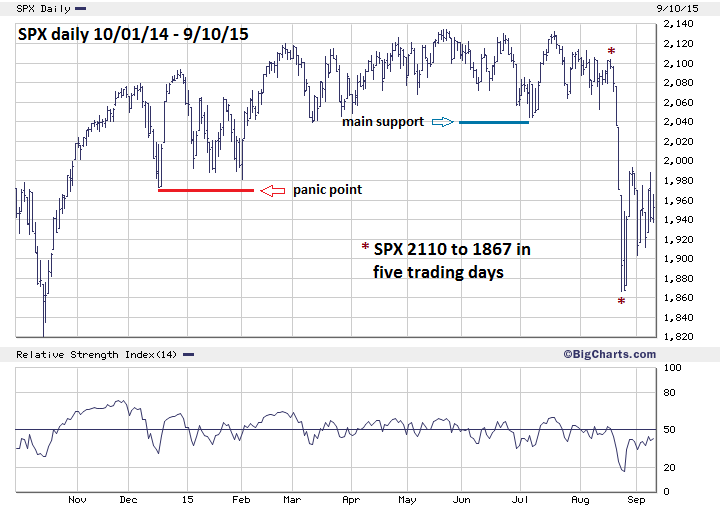
| S&P 500 – 2015 Please see the daily 2014-2015 SPX chart illustrated in Figure 2. After the break of the post May 20, 2015 trading range (which looks very much like the post August 15, 2016 trading range) the SPX quickly reached the next support level in the 1970 area and punched through in panic trading. The reason for the rapid August decline had been developing for several weeks - deteriorating momentum. Please see my July 30, 2015 article "A Ludicrous Non-Confirmation" and my October 3, 2016 article "Nasdaq Versus The World". The Nasdaq was the last main US stock index to register a new high in 2015 which was unconfirmed by many other stock indices and sector ETFs. So far in 2016 the Nasdaq again is the last main US stock index to register a new high, with momentum more bearish than in 2015. In 2016 there are even less sector ETFs registering new highs. Also, the discrepancy between the Nasdaq and major international stock indices is greater than in 2015. |
|
| Figure 2. The reason for the rapid August decline had been developing for several weeks — deteriorating momentum. |
| Graphic provided by: BigCharts.com. |
| |
| Summary and Strategy The next Fibonacci time cycle turn is due on November 1, 2016. This turn could be a top or a bottom — bearish momentum and seasonal factors favor a bottom. The SPX closed October 21, 2016 at 2141. It may seem impossible for the SPX to reach the 1800 area in just eight trading days but it is within the realm of probabilities — the 2015 mini crash only took five trading days. Most traders and investors have been lulled into a state of complacency by the recent narrow trading range. The last thing they expect is a sudden sharp break to the downside. My previous recommendation was to exit all long stock positions if the SPX broke below 2118 which happened on October 13th. If you are still holding long positions liquidate them as soon as possible. Increase short stock positions to 100% if the SPX breaks below 2114 and lower the stop loss from SPX 2270 to 2194. Further Reading: Frost A.J and Robert Prechter (1985) "Elliott Wave Principle", New Classics Library. |
Independent investment advisor, trader and writer. He has written articles for Technical Analysis of Stocks & Commodities, Traders.com Advantage,Futuresmag.com and, Finance Magnates. Author of website Four Dimension Trading.
| Website: | www.fourdimensiontrading.com |
| E-mail address: | markrivest@gmail.com |
Click here for more information about our publications!
Comments

Request Information From Our Sponsors
- StockCharts.com, Inc.
- Candle Patterns
- Candlestick Charting Explained
- Intermarket Technical Analysis
- John Murphy on Chart Analysis
- John Murphy's Chart Pattern Recognition
- John Murphy's Market Message
- MurphyExplainsMarketAnalysis-Intermarket Analysis
- MurphyExplainsMarketAnalysis-Visual Analysis
- StockCharts.com
- Technical Analysis of the Financial Markets
- The Visual Investor
- VectorVest, Inc.
- Executive Premier Workshop
- One-Day Options Course
- OptionsPro
- Retirement Income Workshop
- Sure-Fire Trading Systems (VectorVest, Inc.)
- Trading as a Business Workshop
- VectorVest 7 EOD
- VectorVest 7 RealTime/IntraDay
- VectorVest AutoTester
- VectorVest Educational Services
- VectorVest OnLine
- VectorVest Options Analyzer
- VectorVest ProGraphics v6.0
- VectorVest ProTrader 7
- VectorVest RealTime Derby Tool
- VectorVest Simulator
- VectorVest Variator
- VectorVest Watchdog