

HOT TOPICS LIST
- MACD
- Fibonacci
- RSI
- Gann
- ADXR
- Stochastics
- Volume
- Triangles
- Futures
- Cycles
- Volatility
- ZIGZAG
- MESA
- Retracement
- Aroon
INDICATORS LIST
LIST OF TOPICS
PRINT THIS ARTICLE
by Matt Blackman
In October 2013 a financial media debate began about how the Dow Jones Industrial Average has been behaving in a strangely familiar manner to 1929. Stocks have yet to repeat the massive collapse.
Position: N/A
Matt Blackman
Matt Blackman is a full-time technical and financial writer and trader. He produces corporate and financial newsletters, and assists clients in getting published in the mainstream media. He is the host of TradeSystemGuru.com. Matt has earned the Chartered Market Technician (CMT) designation. Find out what stocks and futures Matt is watching on Twitter at www.twitter.com/RatioTrade
PRINT THIS ARTICLE
CHART ANALYSIS
Checking In On The 1929 Dow Jones Analog Debate
03/20/14 04:27:22 PMby Matt Blackman
In October 2013 a financial media debate began about how the Dow Jones Industrial Average has been behaving in a strangely familiar manner to 1929. Stocks have yet to repeat the massive collapse.
Position: N/A
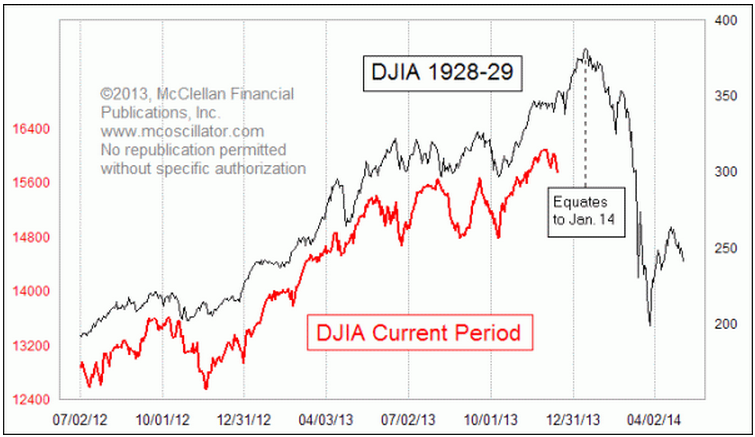
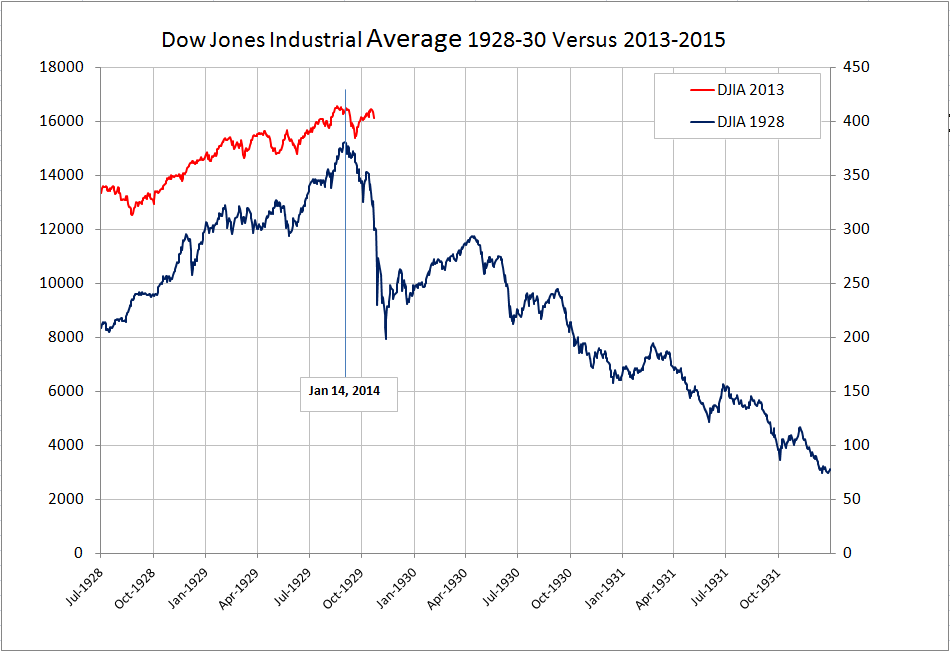
| In the fall of 2013, a debate began mostly thanks to a chart that had been published by veteran trade analyst Tom McClellan of http://www.mcoscillator.com/. McClellan published two reports on November 27, 2013 and again on December 12, 2013 including a chart, the latest of which is shown in Figure 1. His charts compared the Dow in 1928-1929 with the same index from 2013 on and showed a striking similarity between the two. And as we see from Figure 2 with the DJIA updated to March 15, 2014, the correlation between the Dow in 1929 and in early 2014 has diverged somewhat. But the big question remains, have the pattern similarities been rendered moot thereby invalidating the bearish forecast or are they still valid? |
| According to McClellan, the operating theory behind price pattern analogs is that similar market conditions can produce similar price patterns. Yet as opponents argue, there were many differences. For example, in 1928 the Fed pushed the discount rate up as high as 5%: today it is near zero with no lift in sight. Then Fed stimulus was being withdrawn: today stimulus continues. Yet as McClellan points out, the price patterns are similar. |
|
| Figure 1. Chart showing similarities between the Dow Jones Industrial Average in 1928-1929 compared to 2012-2014. |
| Graphic provided by: http://www.mcoscillator.com/learning_center/weekly. |
| |
| As discussed in previous articles, (Warren's Best Valuation Measure, As Goes January, How to Trade a Bubble, and Market Topping Signs Continue) there are a number of compelling market top warnings that have popped up in the last few months. And continued Fed Quantitative Easing is one of the biggest factors keeping markets aloft. |
|
| Figure 2. Chart comparing the Dow Jones Industrial Average in two time periods: 1928� 932 (blue) and 2013� 2016 (red) with the latter showing data updated to March 14, 2014. |
| Graphic provided by: Data - St Louis Federal Reserve. |
| |
| No doubt pundits on both sides of the argument will keep the analog debate alive until markets either cooperate or the pattern similarities between the two periods are invalidated. |
| For the latest from Tom McClellan on the issue, be sure to check A Review of Analogs available free here. |
Matt Blackman is a full-time technical and financial writer and trader. He produces corporate and financial newsletters, and assists clients in getting published in the mainstream media. He is the host of TradeSystemGuru.com. Matt has earned the Chartered Market Technician (CMT) designation. Find out what stocks and futures Matt is watching on Twitter at www.twitter.com/RatioTrade
| Company: | TradeSystemGuru.com |
| Address: | Box 2589 |
| Garibaldi Highlands, BC Canada | |
| Phone # for sales: | 604-898-9069 |
| Fax: | 604-898-9069 |
| Website: | www.tradesystemguru.com |
| E-mail address: | indextradermb@gmail.com |
Traders' Resource Links | |
| TradeSystemGuru.com has not added any product or service information to TRADERS' RESOURCE. | |
Click here for more information about our publications!
Comments

Request Information From Our Sponsors
- StockCharts.com, Inc.
- Candle Patterns
- Candlestick Charting Explained
- Intermarket Technical Analysis
- John Murphy on Chart Analysis
- John Murphy's Chart Pattern Recognition
- John Murphy's Market Message
- MurphyExplainsMarketAnalysis-Intermarket Analysis
- MurphyExplainsMarketAnalysis-Visual Analysis
- StockCharts.com
- Technical Analysis of the Financial Markets
- The Visual Investor
- VectorVest, Inc.
- Executive Premier Workshop
- One-Day Options Course
- OptionsPro
- Retirement Income Workshop
- Sure-Fire Trading Systems (VectorVest, Inc.)
- Trading as a Business Workshop
- VectorVest 7 EOD
- VectorVest 7 RealTime/IntraDay
- VectorVest AutoTester
- VectorVest Educational Services
- VectorVest OnLine
- VectorVest Options Analyzer
- VectorVest ProGraphics v6.0
- VectorVest ProTrader 7
- VectorVest RealTime Derby Tool
- VectorVest Simulator
- VectorVest Variator
- VectorVest Watchdog