HOT TOPICS LIST
- MACD
- Fibonacci
- RSI
- Gann
- ADXR
- Stochastics
- Volume
- Triangles
- Futures
- Cycles
- Volatility
- ZIGZAG
- MESA
- Retracement
- Aroon
INDICATORS LIST
LIST OF TOPICS
PRINT THIS ARTICLE
by Matt Blackman
When the Oracle of Omaha speaks, people listen, especially when it's about stock values.
Position: N/A
Matt Blackman
Matt Blackman is a full-time technical and financial writer and trader. He produces corporate and financial newsletters, and assists clients in getting published in the mainstream media. He is the host of TradeSystemGuru.com. Matt has earned the Chartered Market Technician (CMT) designation. Find out what stocks and futures Matt is watching on Twitter at www.twitter.com/RatioTrade
PRINT THIS ARTICLE
MARKET TIMING
Warren's Best Valuation Measure
02/11/14 04:26:03 PMby Matt Blackman
When the Oracle of Omaha speaks, people listen, especially when it's about stock values.
Position: N/A
| Warren Buffett rarely pontificates on the topic of stock market valuation but when he does, people listen. And one of his favorite metrics according to a 2001 Fortune Magazine article is total US market capitalization to U.S. GDP (or GNP depending on who you listen to). It's a metric that Buffett has said is "probably the best single measure of valuations stand at any given moment." |
| He used the metric to issue an overall buy recommendation in early 2009 according to this Fortune article (see "Buffett's metric says it's time to buy"). |

|
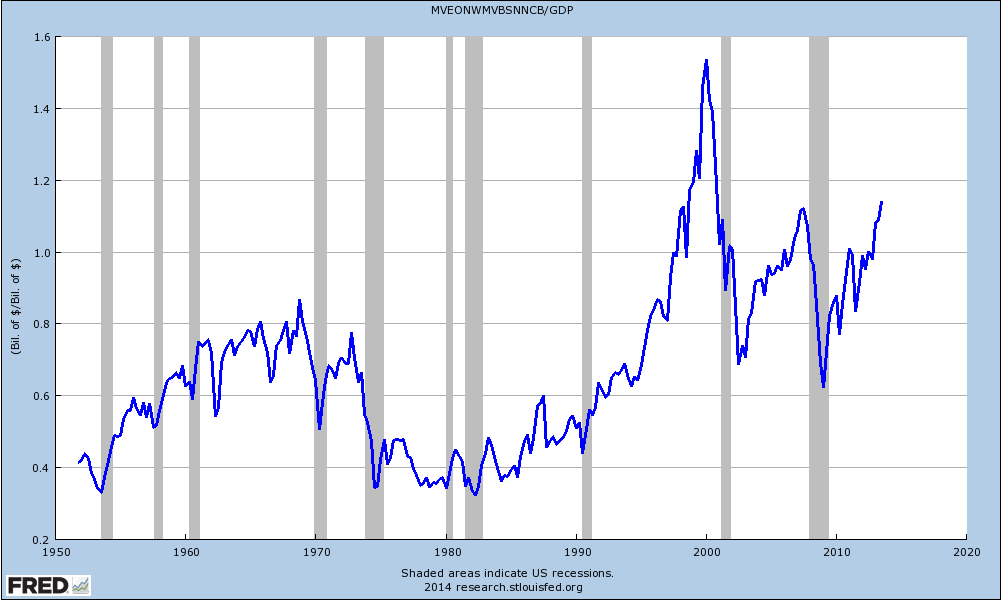
| Figure 1 – Quarterly data showing U.S. stock market capitalization to GDP from the early 1950s through 2013 together with official recessions in gray. |
| Graphic provided by: www.research.stlouisfed.org. |
| |
| So how well has his metric worked in the past and what is it saying right now? As it happens the data (published quarterly) is available from the St. Louis Federal Reserve website. When US stock market cap surpasses 100% of GDP, caution is advised. As we see in Figure 1, market cap has been above the 100% threshold three times so far in the new millennium, surging well above previous peaks to more than 150% in 1999. The latest data available as of early February 2014 puts the current level at 114% which is slightly higher than the peak of 112% in July 2007, prior to the financial crisis that decimated markets and economies around the globe. |
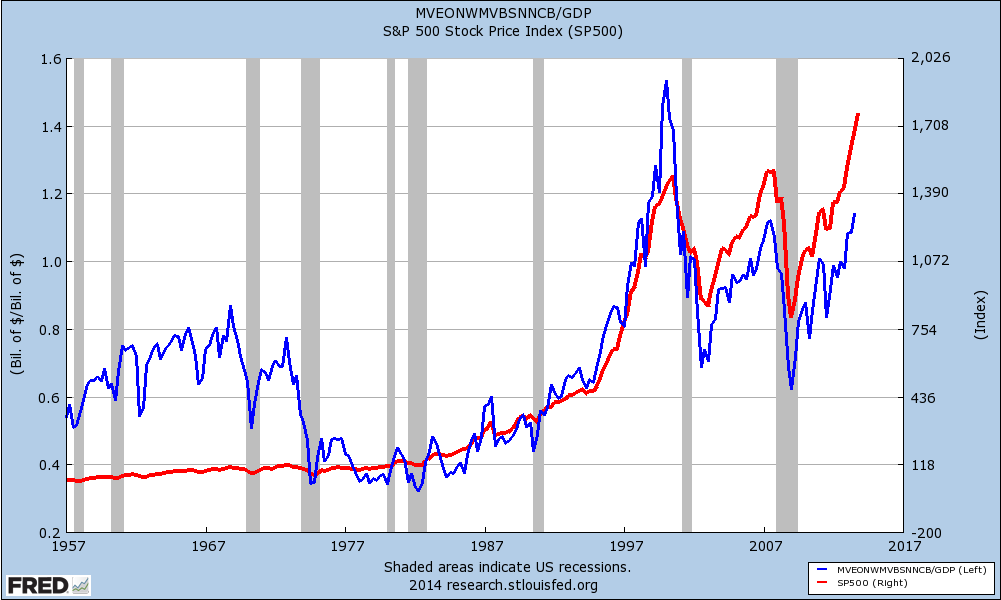
| In Figure 2, we see the Buffett valuation metric plotted together with the S&P500 Index. Market capitalization to GDP was below 100% for major market corrections prior to 2000 and the extreme level in 1999 was unprecedented. Clearly, there is no magic level at which a correction is guaranteed — all we have to go by is past levels. |

|
| Figure 2 – Total US stock market valuation to GDP (blue) versus the S&P500 Index (red) showing the relationship between the two. |
| Graphic provided by: www.research.stlouisfed.org. |
| |
| Market cap to GDP first moved above 100% in July 2012 and has been consistently rising since January 2013 according to Federal Reserve data. The latest figure we have is from July 2013 which is one drawback of the indicator — by the time we get the data they are more than six months old. However, knowing stocks are overvalued according to Buffett's best valuation measure means a major correction could come at anytime. And that's something you can take to the bank. Suggested Reading: Warren Buffett on the Stock Market Warren Buffett's Favorite Valuation Metric Surges Over 100% Market Valuation Overview: Yet More Expensive |
Matt Blackman is a full-time technical and financial writer and trader. He produces corporate and financial newsletters, and assists clients in getting published in the mainstream media. He is the host of TradeSystemGuru.com. Matt has earned the Chartered Market Technician (CMT) designation. Find out what stocks and futures Matt is watching on Twitter at www.twitter.com/RatioTrade
| Company: | TradeSystemGuru.com |
| Address: | Box 2589 |
| Garibaldi Highlands, BC Canada | |
| Phone # for sales: | 604-898-9069 |
| Fax: | 604-898-9069 |
| Website: | www.tradesystemguru.com |
| E-mail address: | indextradermb@gmail.com |
Traders' Resource Links | |
| TradeSystemGuru.com has not added any product or service information to TRADERS' RESOURCE. | |
Click here for more information about our publications!
Comments
Date: 02/11/14Rank: 5Comment:

Request Information From Our Sponsors
- StockCharts.com, Inc.
- Candle Patterns
- Candlestick Charting Explained
- Intermarket Technical Analysis
- John Murphy on Chart Analysis
- John Murphy's Chart Pattern Recognition
- John Murphy's Market Message
- MurphyExplainsMarketAnalysis-Intermarket Analysis
- MurphyExplainsMarketAnalysis-Visual Analysis
- StockCharts.com
- Technical Analysis of the Financial Markets
- The Visual Investor
- VectorVest, Inc.
- Executive Premier Workshop
- One-Day Options Course
- OptionsPro
- Retirement Income Workshop
- Sure-Fire Trading Systems (VectorVest, Inc.)
- Trading as a Business Workshop
- VectorVest 7 EOD
- VectorVest 7 RealTime/IntraDay
- VectorVest AutoTester
- VectorVest Educational Services
- VectorVest OnLine
- VectorVest Options Analyzer
- VectorVest ProGraphics v6.0
- VectorVest ProTrader 7
- VectorVest RealTime Derby Tool
- VectorVest Simulator
- VectorVest Variator
- VectorVest Watchdog
