

HOT TOPICS LIST
- MACD
- Fibonacci
- RSI
- Gann
- ADXR
- Stochastics
- Volume
- Triangles
- Futures
- Cycles
- Volatility
- ZIGZAG
- MESA
- Retracement
- Aroon
INDICATORS LIST
LIST OF TOPICS
PRINT THIS ARTICLE
by Matt Blackman
In February 2013 I wrote an article about the US stock markets exhibiting four conditions that warned of a market top. According to the signals, stock market risk had increased to the highest one percentile of all historical observations by the end of January 2013. This signal is still flashing.
Position: N/A
Matt Blackman
Matt Blackman is a full-time technical and financial writer and trader. He produces corporate and financial newsletters, and assists clients in getting published in the mainstream media. He is the host of TradeSystemGuru.com. Matt has earned the Chartered Market Technician (CMT) designation. Find out what stocks and futures Matt is watching on Twitter at www.twitter.com/RatioTrade
PRINT THIS ARTICLE
PRICE/EARNINGS RATIO
More Stock Market Topping Signs (Continued)
07/10/13 04:23:59 PMby Matt Blackman
In February 2013 I wrote an article about the US stock markets exhibiting four conditions that warned of a market top. According to the signals, stock market risk had increased to the highest one percentile of all historical observations by the end of January 2013. This signal is still flashing.
Position: N/A
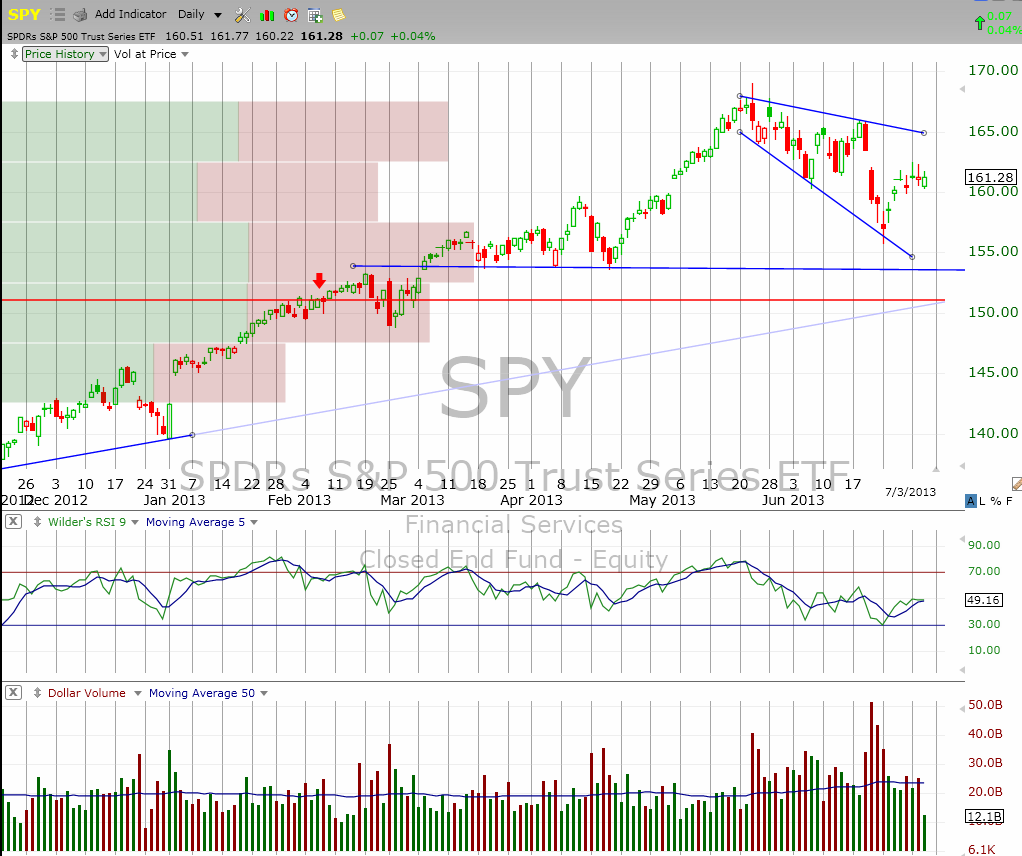
| In late January 2013, a number of factors lined up to generate a Secular Trend Score (STS) sell signal according to Prometheus Market Insight (PMI), a company that generates short-term and long-term buy and sell signals based on a combination of technical and fundamental factors. As the name implies, Secular Trend Score signals are relatively rare. Secular sell signals of this magnitude have only been issued four times before - 1929, 1973, 2000 and 2007. The problem with secular signals like this is that they can begin flashing months or even years in advance of the event. As we see from the chart in Figure 1, the latest signal flashed when the SPY was trading just above 150. But it continued to rally, hitting an end-of-day close above 167 in late May before backing off. |
| According to PMI, the big secular drops were preceded by the following conditions outlined by John Hussman and preceded drops ranging from 20% (post January 2011) to 85% (post August 1929) and exceeded drops of 50% on average. |
|
| Figure 1 � Daily chart of the Standard & Poor�s 500 Trust Series ETF (SPY) showing when the initial market top warning signal was issued (horizontal red line) and moves since then. |
| Graphic provided by: TC2000.com. |
| |
| Here are the four conditions: 1) The Robert Shiller's S&P 500 trailing 10-year price/earnings ratio is at or above 18, which Shiller considers overvalued. The current reading is around 24. 2) Hussman considers the SPX overbought when it is more than 7% above its 52-week moving average, at least 50% above its four-year low, and within 3% of its upper Bollinger Band. Currently, the SPX is either at or above these three measures. 3) Investor sentiment as measured by Investors Intelligence in which bullishness is confirmed when bulls number more than 52% and the bears less than 28%. As of May there were 52.1% bulls versus just 19.8% bears. 4) Hussman's final condition requires that 10-year US Treasury yields are rising and above the level of six months prior, which has been the case since the end of January. |
|
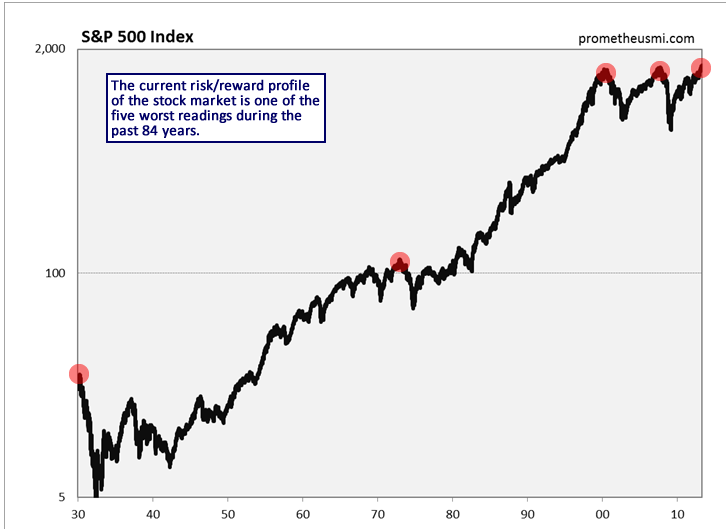
| Figure 2 � Chart from Prometheus Market Insights showing previous Secular Trend Score sell signals. The trick is having the patience to wait for the bottom to fall out which can take months or longer. |
| Graphic provided by: http://www.prometheusmi.com. |
| |
| Perhaps the best way to look at where the stock market is now is to use a mountain-climbing analogy. Say we are on Mount Everest and are on oxygen. The temperature is -10 Fahrenheit and the winds are blowing at 30-40 miles per hour. If the weather holds, we have a chance to summit, but the risks are increasing that we won't make it back down the mountain. Anyone who doesn't appreciate these risks combined with the fact that we are in the death zone is probably suffering from euphoria and has a far greater chance of getting caught unprepared when the conditions change for the worse. |
Matt Blackman is a full-time technical and financial writer and trader. He produces corporate and financial newsletters, and assists clients in getting published in the mainstream media. He is the host of TradeSystemGuru.com. Matt has earned the Chartered Market Technician (CMT) designation. Find out what stocks and futures Matt is watching on Twitter at www.twitter.com/RatioTrade
| Company: | TradeSystemGuru.com |
| Address: | Box 2589 |
| Garibaldi Highlands, BC Canada | |
| Phone # for sales: | 604-898-9069 |
| Fax: | 604-898-9069 |
| Website: | www.tradesystemguru.com |
| E-mail address: | indextradermb@gmail.com |
Traders' Resource Links | |
| TradeSystemGuru.com has not added any product or service information to TRADERS' RESOURCE. | |
Click here for more information about our publications!
Comments
Date:�07/12/13Rank:�5Comment:�
Date:�07/18/13Rank:�3Comment:�
Date:�07/30/13Rank:�5Comment:�

Request Information From Our Sponsors
- StockCharts.com, Inc.
- Candle Patterns
- Candlestick Charting Explained
- Intermarket Technical Analysis
- John Murphy on Chart Analysis
- John Murphy's Chart Pattern Recognition
- John Murphy's Market Message
- MurphyExplainsMarketAnalysis-Intermarket Analysis
- MurphyExplainsMarketAnalysis-Visual Analysis
- StockCharts.com
- Technical Analysis of the Financial Markets
- The Visual Investor
- VectorVest, Inc.
- Executive Premier Workshop
- One-Day Options Course
- OptionsPro
- Retirement Income Workshop
- Sure-Fire Trading Systems (VectorVest, Inc.)
- Trading as a Business Workshop
- VectorVest 7 EOD
- VectorVest 7 RealTime/IntraDay
- VectorVest AutoTester
- VectorVest Educational Services
- VectorVest OnLine
- VectorVest Options Analyzer
- VectorVest ProGraphics v6.0
- VectorVest ProTrader 7
- VectorVest RealTime Derby Tool
- VectorVest Simulator
- VectorVest Variator
- VectorVest Watchdog