

HOT TOPICS LIST
- MACD
- Fibonacci
- RSI
- Gann
- ADXR
- Stochastics
- Volume
- Triangles
- Futures
- Cycles
- Volatility
- ZIGZAG
- MESA
- Retracement
- Aroon
INDICATORS LIST
LIST OF TOPICS
PRINT THIS ARTICLE
by Matt Blackman
"Every down January on the S&P500 since 1950 without exception has preceded a new or extended bear market, a flat market or 10% correction." 2014 Stock Trader's Almanac
Position: N/A
Matt Blackman
Matt Blackman is a full-time technical and financial writer and trader. He produces corporate and financial newsletters, and assists clients in getting published in the mainstream media. He is the host of TradeSystemGuru.com. Matt has earned the Chartered Market Technician (CMT) designation. Find out what stocks and futures Matt is watching on Twitter at www.twitter.com/RatioTrade
PRINT THIS ARTICLE
CYCLES
As Goes January...
02/05/14 03:01:45 PMby Matt Blackman
"Every down January on the S&P500 since 1950 without exception has preceded a new or extended bear market, a flat market or 10% correction." 2014 Stock Trader's Almanac
Position: N/A
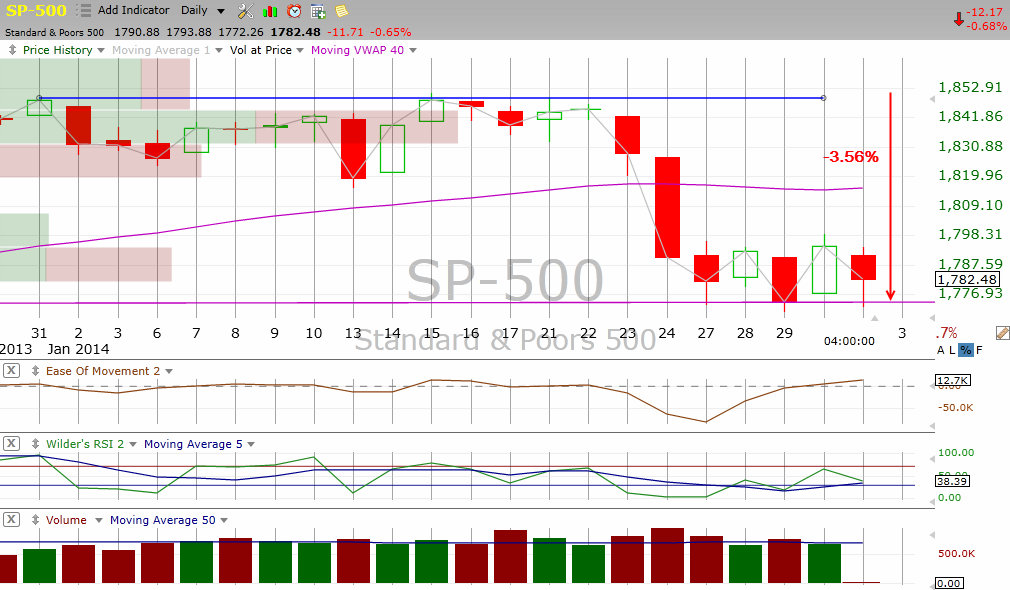
| It's official. In the month of January 2014, the S&P 500 Index lost 3.6% from its December 2013 close (Figure 1). So what? Historically speaking this has bearish implications for the rest of the year according to the Stock Trader's Almanac. An indicator called the January Barometer devised by Yale Hirsch, founder of the Trader's Almanac book series, has only registered "seven major errors" in the last 63 years, which works out to an accuracy rate of 88.9%. It says that as goes January for the SPX, so goes the rest of the year. |
|
| Figure 1 � Daily chart showing January 2014 performance for the S&P 500 Index. |
| Graphic provided by: TC2000.com. |
| |
| Performance in mid-term election years has been somewhat lower however -- the year has followed January's performance in 10 out of 16 times in the last 63 years for an accuracy rate of 62.5% according to the Almanac. |
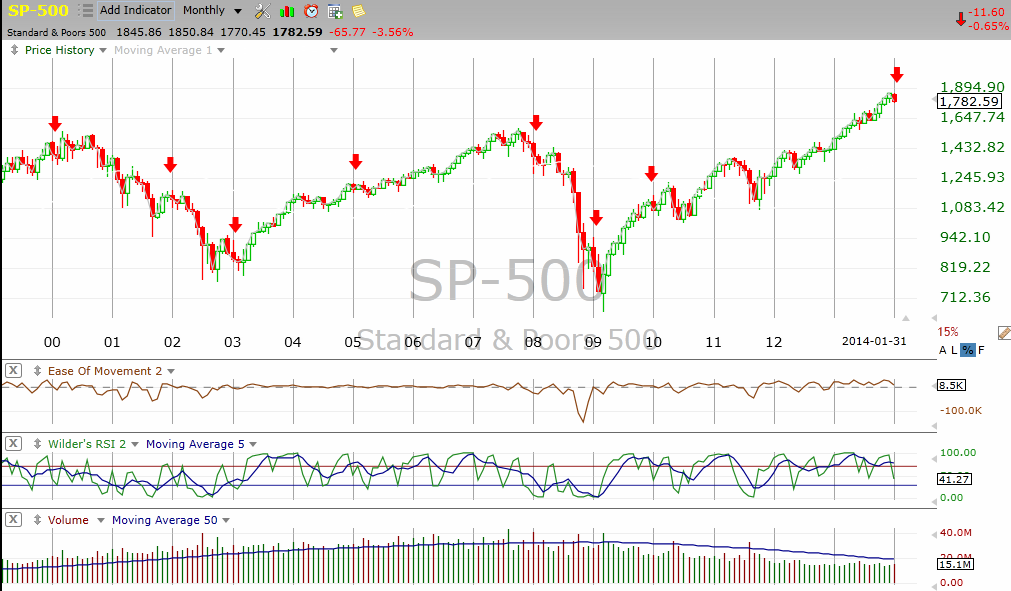
| January Barometer accuracy has dropped significantly in the last 20 years thanks to a combination of factors. As we see from Figure 2, of seven down Januarys since 1994, three have preceded down years due to the beginning of two bull markets commencing in the second quarter (2003 and 2009) and the unprecedented central bank stimulus that began in 2008 has also helped buoy stocks since then. |
|
| Figure 2 � In the last 20 years up to 2014, of seven Januarys that ended lower only three preceded year-end losses thanks to the beginning of two bull markets in 2003 and 2009, and unprecedented central bank stimulus programs beginning in 2008. |
| Graphic provided by: TC2000.com. |
| |
| But there is one elephant in the room that increases the probability of an accurate 2014 January Barometer forecast, which I have discussed in previous articles. According to market analytic group Prometheus Market Insights, stock market risk has consistently remained in the top one percentile of risk since early 2013 matching only three other times in stock market history since the 1920s. Those periods were the major tops in 1929, 2000 and 2007 which were also accompanied by extreme levels of bullish investor sentiment, record high margin debt, extreme levels of overall stock market capitalization to US GDP and record corporate after-tax profits. Ladies and gentlemen, place your trades accordingly. |
| Suggested Reading: January Barometer Results Are In Historic Sentiment Extreme Suggests Stock Market Bubble on Verge of Collapse The Election Cycle Meets Mean Reversion |
Matt Blackman is a full-time technical and financial writer and trader. He produces corporate and financial newsletters, and assists clients in getting published in the mainstream media. He is the host of TradeSystemGuru.com. Matt has earned the Chartered Market Technician (CMT) designation. Find out what stocks and futures Matt is watching on Twitter at www.twitter.com/RatioTrade
| Company: | TradeSystemGuru.com |
| Address: | Box 2589 |
| Garibaldi Highlands, BC Canada | |
| Phone # for sales: | 604-898-9069 |
| Fax: | 604-898-9069 |
| Website: | www.tradesystemguru.com |
| E-mail address: | indextradermb@gmail.com |
Traders' Resource Links | |
| TradeSystemGuru.com has not added any product or service information to TRADERS' RESOURCE. | |
Click here for more information about our publications!
Comments

Request Information From Our Sponsors
- StockCharts.com, Inc.
- Candle Patterns
- Candlestick Charting Explained
- Intermarket Technical Analysis
- John Murphy on Chart Analysis
- John Murphy's Chart Pattern Recognition
- John Murphy's Market Message
- MurphyExplainsMarketAnalysis-Intermarket Analysis
- MurphyExplainsMarketAnalysis-Visual Analysis
- StockCharts.com
- Technical Analysis of the Financial Markets
- The Visual Investor
- VectorVest, Inc.
- Executive Premier Workshop
- One-Day Options Course
- OptionsPro
- Retirement Income Workshop
- Sure-Fire Trading Systems (VectorVest, Inc.)
- Trading as a Business Workshop
- VectorVest 7 EOD
- VectorVest 7 RealTime/IntraDay
- VectorVest AutoTester
- VectorVest Educational Services
- VectorVest OnLine
- VectorVest Options Analyzer
- VectorVest ProGraphics v6.0
- VectorVest ProTrader 7
- VectorVest RealTime Derby Tool
- VectorVest Simulator
- VectorVest Variator
- VectorVest Watchdog