

HOT TOPICS LIST
- MACD
- Fibonacci
- RSI
- Gann
- ADXR
- Stochastics
- Volume
- Triangles
- Futures
- Cycles
- Volatility
- ZIGZAG
- MESA
- Retracement
- Aroon
INDICATORS LIST
LIST OF TOPICS
PRINT THIS ARTICLE
by Matt Blackman
It has been called the most powerful stock market cycle. So what is it telling us about where stocks are headed?
Position: N/A
Matt Blackman
Matt Blackman is a full-time technical and financial writer and trader. He produces corporate and financial newsletters, and assists clients in getting published in the mainstream media. He is the host of TradeSystemGuru.com. Matt has earned the Chartered Market Technician (CMT) designation. Find out what stocks and futures Matt is watching on Twitter at www.twitter.com/RatioTrade
PRINT THIS ARTICLE
ECON CYCLE TRADING
The Election Cycle Meets Mean Reversion
01/15/14 04:33:53 PMby Matt Blackman
It has been called the most powerful stock market cycle. So what is it telling us about where stocks are headed?
Position: N/A
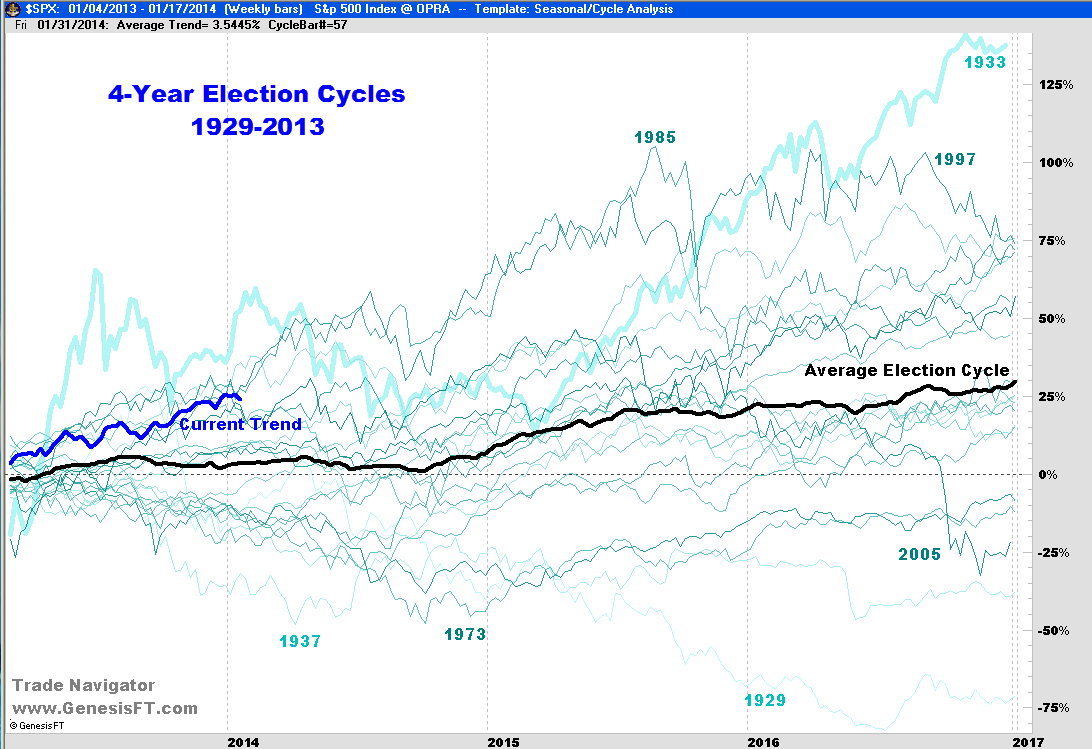
| Called the "old faithful" cycle in The Little Book of Stock Market Cycles by Jeff Hirsch, the election or presidential cycle has had a powerful influence on stocks over the last 180 years. As Figure 1 shows, the first year of the latest cycle, although not the best performing post-election year, is up there with a total S&P500 return of 25.57% for 2013. This is effectively 10 times the return of the average post-election year since 1929 of 2.54%. The question is how long can this election cycle continue to perform so far above average? |
|
| Figure 1 � Chart showing 4-year election cycles since the 1929-1932 cycle for the S&P500 Index. Note that the 1933 cycle was the best performing and the 1929 the worst with current (2013) fourth-best performing of the 22 cycles so far. |
| Graphic provided by: Trade Navigator www.GenesisFT.com. |
| |
| So what powers the election cycle? According to The Little Book, it's a result of government efforts to manipulate the economy to stay in power and like the Fed, it is a force that traders can't afford to ignore. So it's no surprise that between 1833 and 2011, the two years before elections have produced total Dow Jones Industrial Average return of 724% versus just 273% for the two years post elections. Since the four-year election cycle starting in 1929, the worst performing mid-term year was -33.8% in 1930 (Herbert Hoover) and the best performing was +44% in 1954 (Dwight Eisenhower). |
|
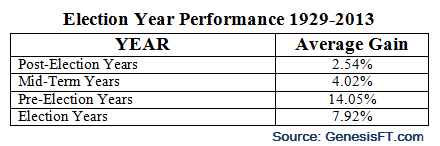
| Figure 2 � Table comparing average election year returns for 22 election cycle years starting in 1929. |
| Graphic provided by: Trade Navigator www.GenesisFT.com. |
| |
| According to the 2014 Stock Trader's Almanac, mid-term election years (dating back to 1833) are the second worst of the four and are notoriously weaker during Democratic presidencies. But mid-term years also have a history of putting in stock price bottoms which subsequently lead to the best performing pre-election years. However, the seemingly unlimited supply of government backed stimulus cash changed the stock trading game. Now instead of just juicing markets going into elections, the government mandate is to do so all the time as evidenced by the rapid explosion in the size of the Federal Reserve balance sheet since 2007. But this trend can't continue indefinitely. How much will the expected tapering change the cycle going forward? |
| Trend-Following versus Mean-Reversion In his book Mean Reversion Trading Systems, Dr Howard Bandy discusses the requirements for building various mean-reversion trading systems. He compared the results of using a simple RSI mean reversing trading system versus a 200 period moving average trend following system using the same data and parameters. Not only did the mean reversion system generate significantly higher returns over the 12-year period, it also experienced smaller draw-downs. The results and charts are available here. In other words, if we can extrapolate Dr Bandy's results, probability strongly favors that election cycle returns will, at some point, revert to their long-term average with a vengeance. This just leaves us with two unknowns — when and by how much? |
| Suggested Reading; Bandy, Howard (2013), Mean Reversion Trading Systems, Blue Owl Press Blackman, Matt (2004) Playing the Presidential Cycle Hirsch, Jeffrey (2012), The Little Book of Stock Market Cycles, John Wiley & Sons Hirsch, Jeffrey (2014), 2014 Stock Trader's Almanac, John Wiley & Sons |
Matt Blackman is a full-time technical and financial writer and trader. He produces corporate and financial newsletters, and assists clients in getting published in the mainstream media. He is the host of TradeSystemGuru.com. Matt has earned the Chartered Market Technician (CMT) designation. Find out what stocks and futures Matt is watching on Twitter at www.twitter.com/RatioTrade
| Company: | TradeSystemGuru.com |
| Address: | Box 2589 |
| Garibaldi Highlands, BC Canada | |
| Phone # for sales: | 604-898-9069 |
| Fax: | 604-898-9069 |
| Website: | www.tradesystemguru.com |
| E-mail address: | indextradermb@gmail.com |
Traders' Resource Links | |
| TradeSystemGuru.com has not added any product or service information to TRADERS' RESOURCE. | |
Click here for more information about our publications!
PRINT THIS ARTICLE

Request Information From Our Sponsors
- StockCharts.com, Inc.
- Candle Patterns
- Candlestick Charting Explained
- Intermarket Technical Analysis
- John Murphy on Chart Analysis
- John Murphy's Chart Pattern Recognition
- John Murphy's Market Message
- MurphyExplainsMarketAnalysis-Intermarket Analysis
- MurphyExplainsMarketAnalysis-Visual Analysis
- StockCharts.com
- Technical Analysis of the Financial Markets
- The Visual Investor
- VectorVest, Inc.
- Executive Premier Workshop
- One-Day Options Course
- OptionsPro
- Retirement Income Workshop
- Sure-Fire Trading Systems (VectorVest, Inc.)
- Trading as a Business Workshop
- VectorVest 7 EOD
- VectorVest 7 RealTime/IntraDay
- VectorVest AutoTester
- VectorVest Educational Services
- VectorVest OnLine
- VectorVest Options Analyzer
- VectorVest ProGraphics v6.0
- VectorVest ProTrader 7
- VectorVest RealTime Derby Tool
- VectorVest Simulator
- VectorVest Variator
- VectorVest Watchdog