HOT TOPICS LIST
- MACD
- Fibonacci
- RSI
- Gann
- ADXR
- Stochastics
- Volume
- Triangles
- Futures
- Cycles
- Volatility
- ZIGZAG
- MESA
- Retracement
- Aroon
INDICATORS LIST
LIST OF TOPICS
PRINT THIS ARTICLE
by Matt Blackman
Incumbent presidents have shown an incredible propensity for shamelessly pumping up the economy in election years. Knowing when is the essential first step to profiting from it.
Position: N/A
Matt Blackman
Matt Blackman is a full-time technical and financial writer and trader. He produces corporate and financial newsletters, and assists clients in getting published in the mainstream media. He is the host of TradeSystemGuru.com. Matt has earned the Chartered Market Technician (CMT) designation. Find out what stocks and futures Matt is watching on Twitter at www.twitter.com/RatioTrade
PRINT THIS ARTICLE
CYCLES
Playing The Presidential Cycle
06/18/04 11:48:19 AMby Matt Blackman
Incumbent presidents have shown an incredible propensity for shamelessly pumping up the economy in election years. Knowing when is the essential first step to profiting from it.
Position: N/A
| A look at charts of the Presidential Cycle since the beginning of the 20th century is an enlightening exercise, especially when seeing them for the first time. It doesn't seem to matter if the president is Democrat or Republican; the outcome is similar during the four-year terms. Markets are generally flat to down in the first two years but show an amazing tendency to take off in the last two years. How much, you ask? In the composite of all 28 Presidential Cycles from 1888 -2000, the Dow Jones Industrial Average dropped in the first year slightly, finished the second year flat, was up by approximately 10% at the end of the third year, and ended the fourth (election year) up more than 20% from the Presidential Cycle midpoint. |

|
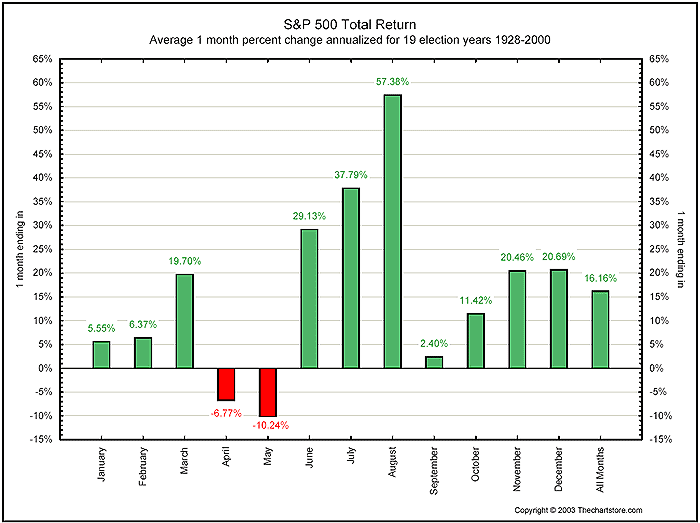
| Figure 1 – S&P500 annualized monthly returns for 19 election years 1928 –2000. |
| Graphic provided by: http://www.thechartstore.com. |
| |
| Here is how the returns break down on an annualized monthly basis in the election year for the S&P 500 compared to all years, including election years. All Years In normal years, the best month was July with an average annualized monthly return of 24.5% for the S&P 500 from 1926 through 2000. The average of all months combined was 12.88%. September has historically been the worst month of the average year, dropping nearly 11% for the month. Election Years In 19 election years from 1928 through 2000, the worst period of the year for the S&P was the period between April - May with an average annualized two-month loss of 17% (see Figure 1). Instead of waiting until September to drop as it normally does, the S&P 500 has a habit of losing ground early during election years and saving its best gains for the second half of the year. August was the best month with an average annualized monthly return at 57%, more than double the all year (normal) August 24.5% average. The average election year monthly return was 16.2% compared to 12.88% for all years. Election year Augusts returned nearly five times the all year monthly average! July was the second best election year month with an average return of 37.8% followed by June, which returned an average 29%. |
| So according to stats for the S&P 500, the best three months to be in the market at least from the perspective of average annualized monthly returns are June, July and August of an election year. The million-dollar question is, will this one be above or below average? |
| SUGGESTED READING: More Cycles Charts http://www.thechartstore.com/html/Other%20Samples.pdf |
Matt Blackman is a full-time technical and financial writer and trader. He produces corporate and financial newsletters, and assists clients in getting published in the mainstream media. He is the host of TradeSystemGuru.com. Matt has earned the Chartered Market Technician (CMT) designation. Find out what stocks and futures Matt is watching on Twitter at www.twitter.com/RatioTrade
| Company: | TradeSystemGuru.com |
| Address: | Box 2589 |
| Garibaldi Highlands, BC Canada | |
| Phone # for sales: | 604-898-9069 |
| Fax: | 604-898-9069 |
| Website: | www.tradesystemguru.com |
| E-mail address: | indextradermb@gmail.com |
Traders' Resource Links | |
| TradeSystemGuru.com has not added any product or service information to TRADERS' RESOURCE. | |
Click here for more information about our publications!
Comments
Date: 06/21/04Rank: 5Comment:
Date: 07/01/04Rank: 5Comment:

Request Information From Our Sponsors
- StockCharts.com, Inc.
- Candle Patterns
- Candlestick Charting Explained
- Intermarket Technical Analysis
- John Murphy on Chart Analysis
- John Murphy's Chart Pattern Recognition
- John Murphy's Market Message
- MurphyExplainsMarketAnalysis-Intermarket Analysis
- MurphyExplainsMarketAnalysis-Visual Analysis
- StockCharts.com
- Technical Analysis of the Financial Markets
- The Visual Investor
- VectorVest, Inc.
- Executive Premier Workshop
- One-Day Options Course
- OptionsPro
- Retirement Income Workshop
- Sure-Fire Trading Systems (VectorVest, Inc.)
- Trading as a Business Workshop
- VectorVest 7 EOD
- VectorVest 7 RealTime/IntraDay
- VectorVest AutoTester
- VectorVest Educational Services
- VectorVest OnLine
- VectorVest Options Analyzer
- VectorVest ProGraphics v6.0
- VectorVest ProTrader 7
- VectorVest RealTime Derby Tool
- VectorVest Simulator
- VectorVest Variator
- VectorVest Watchdog
