

HOT TOPICS LIST
- MACD
- Fibonacci
- RSI
- Gann
- ADXR
- Stochastics
- Volume
- Triangles
- Futures
- Cycles
- Volatility
- ZIGZAG
- MESA
- Retracement
- Aroon
INDICATORS LIST
LIST OF TOPICS
PRINT THIS ARTICLE
by Matt Blackman
Stocks continue to gain ground in a rally that has been going since March 2009. In February 2013, a combination of factors converged to generate a secular sell signal that paralleled the biggest peaks in modern history. Does that means that it's time to head for the hills?
Position: N/A
Matt Blackman
Matt Blackman is a full-time technical and financial writer and trader. He produces corporate and financial newsletters, and assists clients in getting published in the mainstream media. He is the host of TradeSystemGuru.com. Matt has earned the Chartered Market Technician (CMT) designation. Find out what stocks and futures Matt is watching on Twitter at www.twitter.com/RatioTrade
PRINT THIS ARTICLE
A/D LINE
How To Trade A Bubble
08/06/13 03:42:11 PMby Matt Blackman
Stocks continue to gain ground in a rally that has been going since March 2009. In February 2013, a combination of factors converged to generate a secular sell signal that paralleled the biggest peaks in modern history. Does that means that it's time to head for the hills?
Position: N/A
| Since early February 2013, when stock market investment risk hit the highest 1 percentile of all historical observations, markets have been in the type of a bubble territory rarely experienced. Back in February a series of fundamental, technical, market internal, and sentiment conditions combined that matched only six other times in history: August 1929, November 1969, November 1972, August 1987, March 2000 and May 2007 according to Prometheus Market Insights (PMI). Since then and after the latest advance during the five weeks up to the end of July, this risk has increased, elevating market risk to match only three other times in history: 1929, 2000 and 2007. |
|
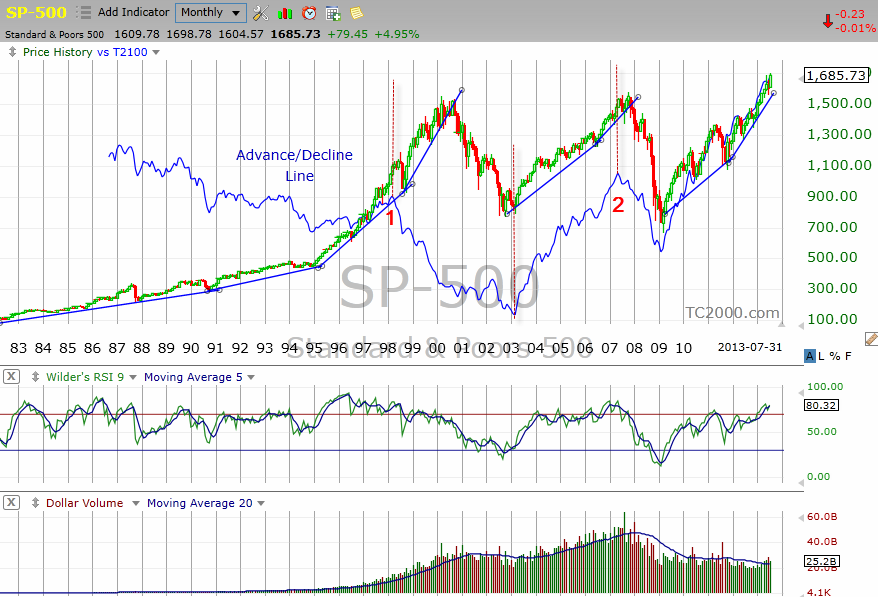
| Figure 1. Monthly chart showing the last three S&P 500 Index "bubbles" together with the Advance / Decline line since the 1980�s. |
| Graphic provided by: TC2000.com. |
| |
| As the chart in Figure 1 shows, peak 1 in the Advance / Decline line (blue), which measures the number of advancing issues versus declining issues, occurred in March 1998, followed by an A/D trough in March 2003. This was followed by peak 2 in May 2007 and trough 2 in March 2009. So is the current bubble about to pop? Here's the problem. Sure, stocks were in still rarefied territory by mid-summer but as most know by now, they can rally much longer than most think they will. Look at what happened with the 2000 peak. Market internals (Advancers/Decliners) peaked 18 months before stocks. At the next market peak in 2007, the A/D line gave a shorter advance warning of five months. At the far left of the chart, the A/D peaked in February 1987, eight months before the biggest ever single-day drop in the Dow and SPX. In other words, market internal weakness can occur months or even years before stocks follow suit. As we see in the chart in Figure 1, even though stocks were at historic extreme levels in February and July 2013, the A/D line was still climbing. |
|
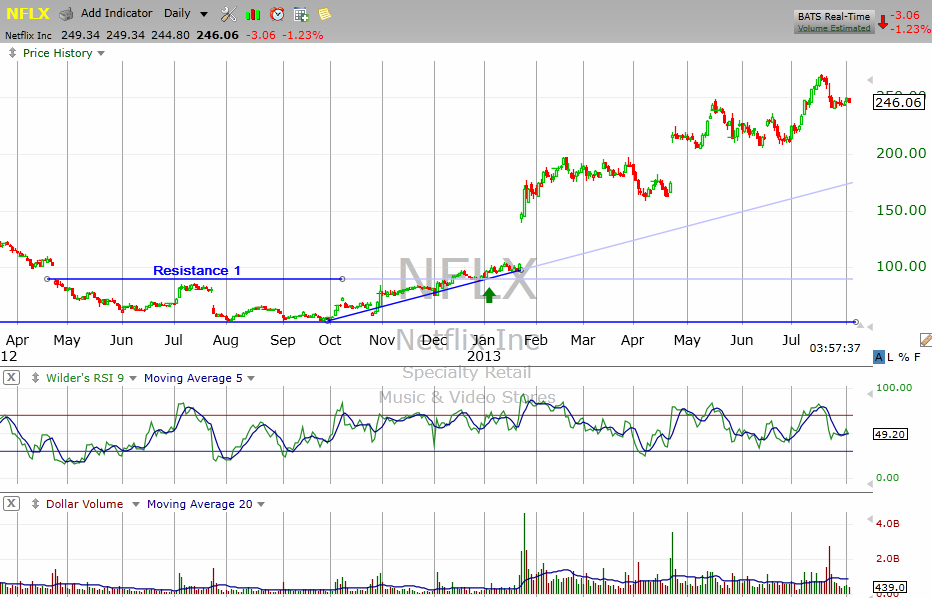
| Figure 2. Daily chart of NetFlix showing the appreciation in the stock price in 2013. |
| Graphic provided by: TC2000.com. |
| |
| Unfortunately, those who acted on the warning signs in February 2013 and exited their positions had left a lot of money on the table by the end of July — nearly 2,000 SPX points and big gains in leaders such as Google (150 points), NetFlix (150 points) and MasterCard (200 points). |
| Let's take a look at Netflix (Figure 2). On January 2, the day after the fiscal cliff dilemma had been dealt with, NFLX was trading around $92. By the beginning of February when the first secular warning was issued, NFLX was trading at around $165. Those who traded on the technicals, ignored the macro picture, and set their stops just below the early February low, stayed in the stock into July when it traded above $240. |
| The moral of the story is that when stocks are bubbling, which often means going parabolic, active traders can make money if they are disciplined, set realistic stops and don't get greedy. That means taking historic secular warning signs like the one issued in February to heart but also realizing that although markets are getting toppy, there is still money to be made with the right approach. |
Matt Blackman is a full-time technical and financial writer and trader. He produces corporate and financial newsletters, and assists clients in getting published in the mainstream media. He is the host of TradeSystemGuru.com. Matt has earned the Chartered Market Technician (CMT) designation. Find out what stocks and futures Matt is watching on Twitter at www.twitter.com/RatioTrade
| Company: | TradeSystemGuru.com |
| Address: | Box 2589 |
| Garibaldi Highlands, BC Canada | |
| Phone # for sales: | 604-898-9069 |
| Fax: | 604-898-9069 |
| Website: | www.tradesystemguru.com |
| E-mail address: | indextradermb@gmail.com |
Traders' Resource Links | |
| TradeSystemGuru.com has not added any product or service information to TRADERS' RESOURCE. | |
Click here for more information about our publications!
PRINT THIS ARTICLE

Request Information From Our Sponsors
- StockCharts.com, Inc.
- Candle Patterns
- Candlestick Charting Explained
- Intermarket Technical Analysis
- John Murphy on Chart Analysis
- John Murphy's Chart Pattern Recognition
- John Murphy's Market Message
- MurphyExplainsMarketAnalysis-Intermarket Analysis
- MurphyExplainsMarketAnalysis-Visual Analysis
- StockCharts.com
- Technical Analysis of the Financial Markets
- The Visual Investor
- VectorVest, Inc.
- Executive Premier Workshop
- One-Day Options Course
- OptionsPro
- Retirement Income Workshop
- Sure-Fire Trading Systems (VectorVest, Inc.)
- Trading as a Business Workshop
- VectorVest 7 EOD
- VectorVest 7 RealTime/IntraDay
- VectorVest AutoTester
- VectorVest Educational Services
- VectorVest OnLine
- VectorVest Options Analyzer
- VectorVest ProGraphics v6.0
- VectorVest ProTrader 7
- VectorVest RealTime Derby Tool
- VectorVest Simulator
- VectorVest Variator
- VectorVest Watchdog