

HOT TOPICS LIST
- MACD
- Fibonacci
- RSI
- Gann
- ADXR
- Stochastics
- Volume
- Triangles
- Futures
- Cycles
- Volatility
- ZIGZAG
- MESA
- Retracement
- Aroon
INDICATORS LIST
LIST OF TOPICS
PRINT THIS ARTICLE
by Matt Blackman
The S&P 500 Index has entered bear market territory. So what does it mean?
Position: N/A
Matt Blackman
Matt Blackman is a full-time technical and financial writer and trader. He produces corporate and financial newsletters, and assists clients in getting published in the mainstream media. Matt has earned the Chartered Market Technician (CMT) designation. Follow Matt on Twitter at www.twitter.com/RatioTrade
PRINT THIS ARTICLE
MARKET TIMING
Recession Watch 2.0
06/29/22 03:28:28 PMby Matt Blackman
The S&P 500 Index has entered bear market territory. So what does it mean?
Position: N/A
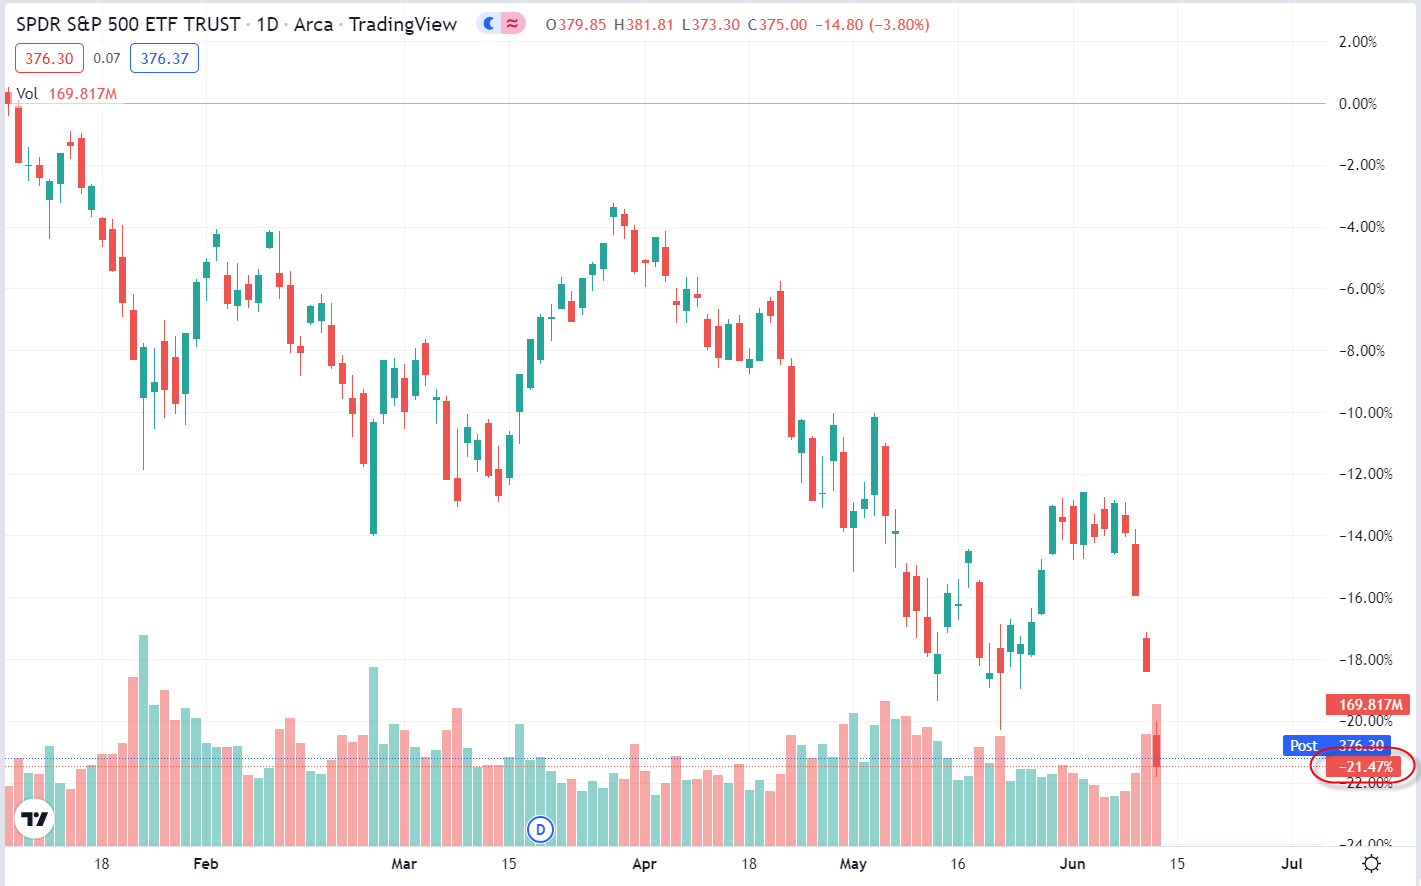
| As June 2022 entered its second week, the S&P 500 Index officially entered bear market territory, dropping more than 20% since early January (see Figure 1). From an overall market perspective, it had held up relatively well, especially compared to some high beta stocks. Although still well out of official recession territory, it was just shot across the bow that economic strength was waning. |
|
| Figure 1. S&P 500 Index EFT (SPY) showing it dropping into bear market territory down more than 21% from its New Year high on June 13, 2022. |
| Graphic provided by: TradingView. |
| |
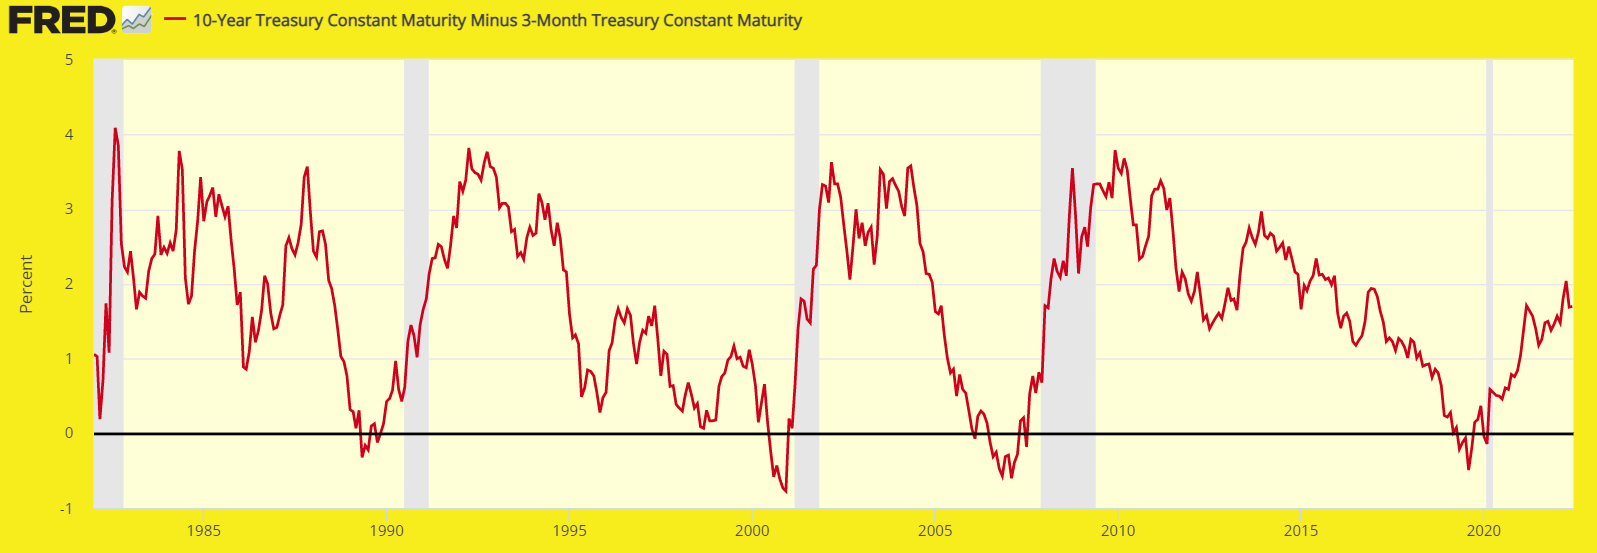
| In late May 2019, 10-year dropped below the three-month Treasury yields and the yield curve remained inverted for roughly five months (see Figure 2). As yield curve inversions go, this was relatively mild but enough to trigger a recession pronouncement by the Bureau of Economic Analysis (BEA) which retroactively declared in November 2020 that US GDP had contracted in Q1 and Q2 (see grey vertical lines indicating official recessions). But as we see, the yield curve quickly reverted and 10-year yields have continued to rise relative to their three-month counterparts. But the damage to stocks has continued to build. |
|
| Figure 2. 10-Year Treasury yield minus the three month yield (red line) showing how inversions (when the first drops below the second) and the recessions that inevitably tend to follow six to 12 months later. |
| Graphic provided by: https://fred.stlouisfed.org/. |
| |
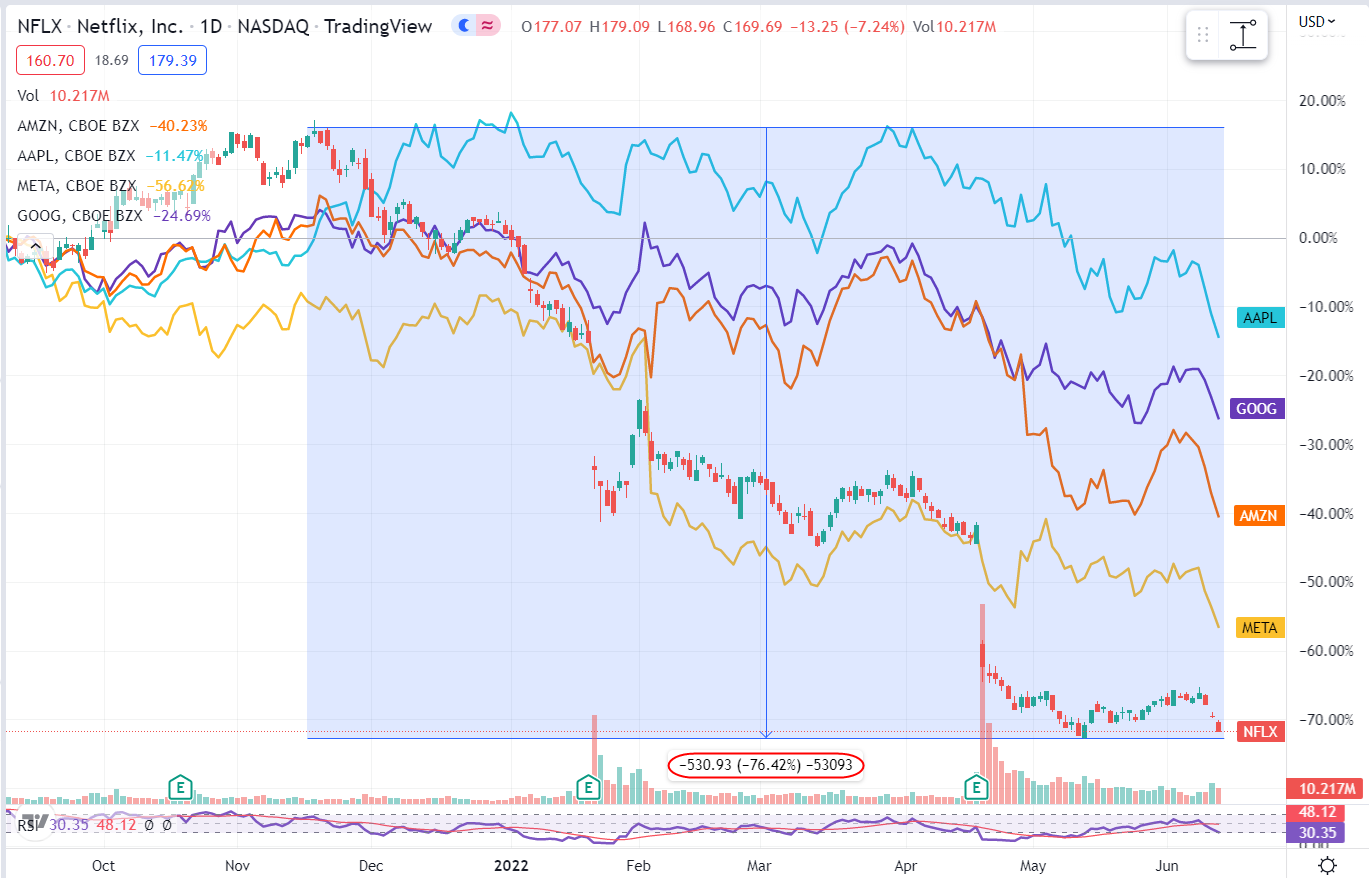
| Taking the Bite Out of FANGs Between its peak in November 2021 and mid-June 2022, the iShare MSCI USA Momentum Factor ETF (MTUM) dropped 30% in price. The MTUM (not shown) is a valuable indicator stock momentum among active stocks so further proof of market weakness. FAANG (Facebook, Amazon, Apple, Netflix and Google) is another indicator pundits love to tout as a measure of market health. Today, the new acronym is MAANG after Facebook changed its name and symbol to META and although we will have to wait to see if the new name catches on, the group has certainly suffered, down an average of roughly 40% YTD. |
|
| Figure 3. Chart of MAANG stocks (formerly FAANG) of META, Amazon, Apple, Google and Netflix showing the range of damage to each in percentage terms since early January 2022. |
| Graphic provided by: TradingView. |
| |
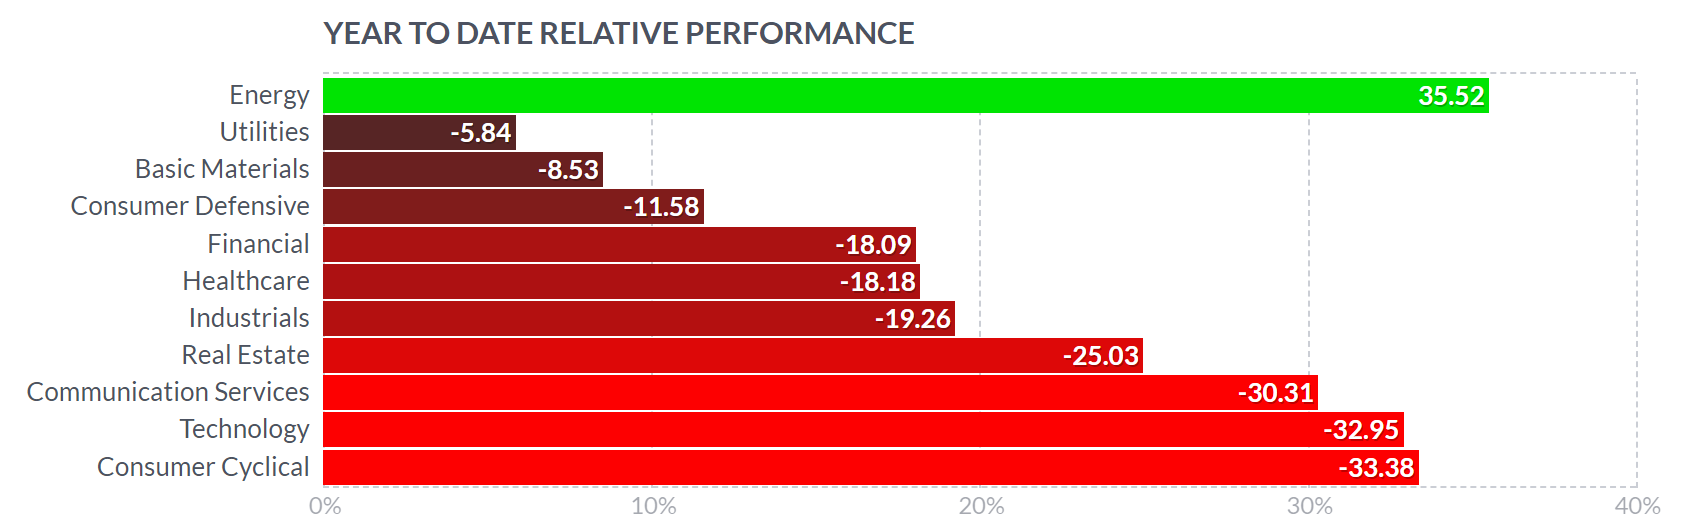
| From a sector perspective, Figure 4 shows how major groups have performed Year-to-Date with only energy stocks having gained ground up more than 35%. Consumer cyclicals, Technology and Communication stocks are off more than 30%. |
|
| Figure 4. Breakdown of sector performance year-to-date. |
| Graphic provided by: https://finviz.com/. |
| |
| So where do markets go from here? As we see in Figure 5, the SPY hit its Head and Shoulders minimum projected target in April 2022 and has continued to trend lower since then (see article, "2022 Off To A Rough Start"). What technicians will be looking for are signs of a bottom with buyer volume capitulation followed by a steady buying in a stair-step action of higher lows followed by higher highs. 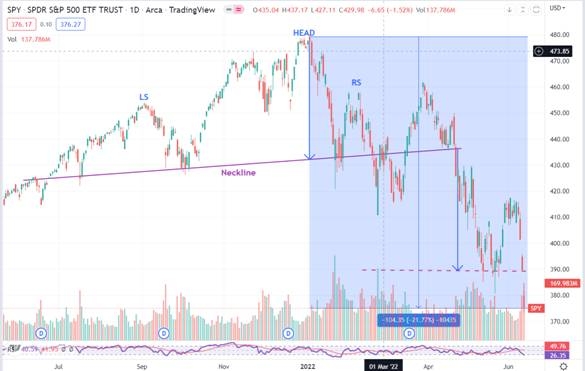 Figure 5. Daily SPY chart showing longer time-frame with the bearish Head & Shoulders pattern that was confirmed April 21, 2022 showing that the pattern quickly hit is minimum projected downside target (dashed red line) followed by a recovery attempt and downside action taking out the previous low. Graphic provided by: TradingView. Going into mid-June, the chart showed neither. Suggested Reading: Recession Watch - Yield Curve Turns Negative Again Buffett Indicator Takes a Pause - Should we be concerned? 2022 Off To A Rough Start |
Matt Blackman is a full-time technical and financial writer and trader. He produces corporate and financial newsletters, and assists clients in getting published in the mainstream media. Matt has earned the Chartered Market Technician (CMT) designation. Follow Matt on Twitter at www.twitter.com/RatioTrade
| Title: | Author |
| Company: | TradeSystemGuru |
| Address: | Box 2589 |
| Garibaldi Highlands, BC V0N1T0 | |
| Phone # for sales: | 6048989069 |
| E-mail address: | indextradermb@gmail.com |
Traders' Resource Links | |
| TradeSystemGuru has not added any product or service information to TRADERS' RESOURCE. | |
Click here for more information about our publications!
Comments

Request Information From Our Sponsors
- StockCharts.com, Inc.
- Candle Patterns
- Candlestick Charting Explained
- Intermarket Technical Analysis
- John Murphy on Chart Analysis
- John Murphy's Chart Pattern Recognition
- John Murphy's Market Message
- MurphyExplainsMarketAnalysis-Intermarket Analysis
- MurphyExplainsMarketAnalysis-Visual Analysis
- StockCharts.com
- Technical Analysis of the Financial Markets
- The Visual Investor
- VectorVest, Inc.
- Executive Premier Workshop
- One-Day Options Course
- OptionsPro
- Retirement Income Workshop
- Sure-Fire Trading Systems (VectorVest, Inc.)
- Trading as a Business Workshop
- VectorVest 7 EOD
- VectorVest 7 RealTime/IntraDay
- VectorVest AutoTester
- VectorVest Educational Services
- VectorVest OnLine
- VectorVest Options Analyzer
- VectorVest ProGraphics v6.0
- VectorVest ProTrader 7
- VectorVest RealTime Derby Tool
- VectorVest Simulator
- VectorVest Variator
- VectorVest Watchdog