

HOT TOPICS LIST
- MACD
- Fibonacci
- RSI
- Gann
- ADXR
- Stochastics
- Volume
- Triangles
- Futures
- Cycles
- Volatility
- ZIGZAG
- MESA
- Retracement
- Aroon
INDICATORS LIST
LIST OF TOPICS
PRINT THIS ARTICLE
by Matt Blackman
A quick look at the market in charts
Position: N/A
Matt Blackman
Matt Blackman is a full-time technical and financial writer and trader. He produces corporate and financial newsletters, and assists clients in getting published in the mainstream media. Matt has earned the Chartered Market Technician (CMT) designation. Follow Matt on Twitter at www.twitter.com/RatioTrade
PRINT THIS ARTICLE
MARKET TIMING
Buffett Indicator Takes a Pause - Should we be concerned?
01/13/22 04:33:31 PMby Matt Blackman
A quick look at the market in charts
Position: N/A
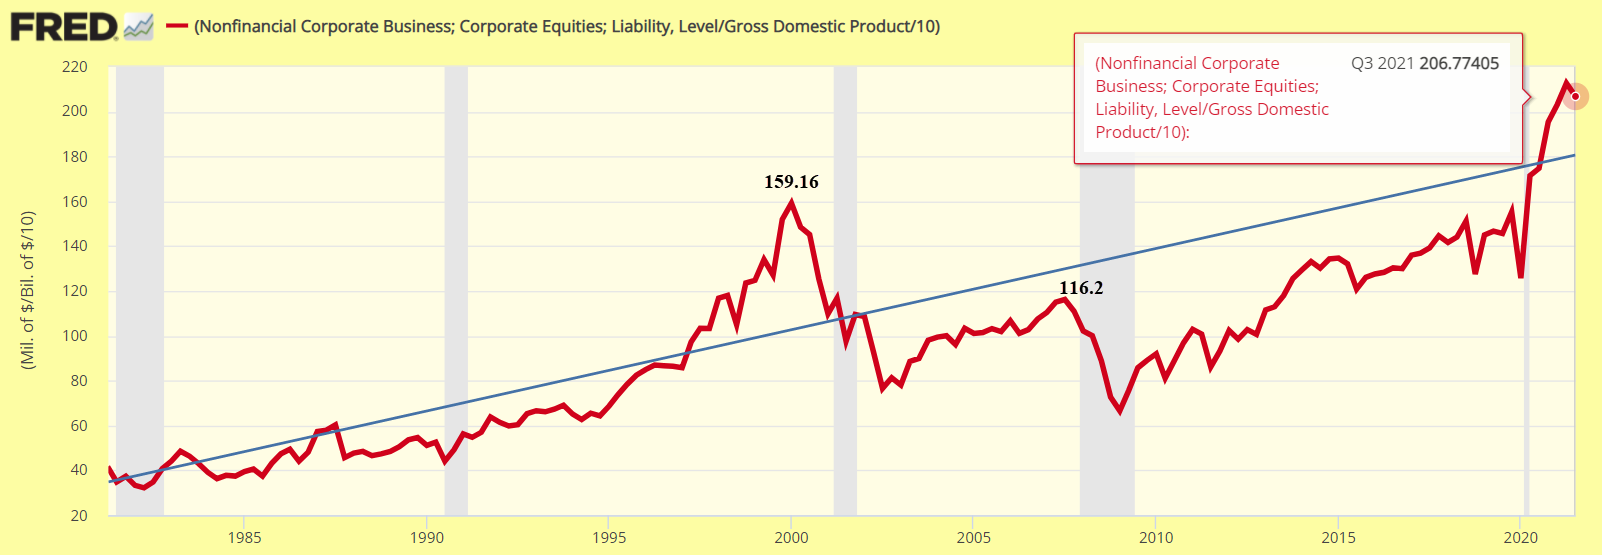
| The year 2021 will go down as the second strangest in modern history. Why? It was the second year of the Covid-19 pandemic, and while parts of the economy struggled through lock-downs and vaccine mandates that severely impacted small businesses, travel, hospitality and a host of other sectors, many stocks continued to stretch for new highs. However by mid-December, the only sectors in positive territory over the prior month were Utilities (+2.99%), Consumer Defensive (+0.88%), Real Estate (+0.17%) and Basic Materials (+0.09%). Consumer Cyclicals were the worst hit losing nearly 10% for the month, followed closely by Communications Services (-6.71%), Energy (-4.92%) and Industrials (-4.83%). Meanwhile, the much vaunted Buffett Market Valuation Index which in a nutshell is total US market capitalization divided by US Gross Domestic Product (GDP), continued to reach new highs in 2020 and 2021, only taking a step back in Q3 2021 (see Figure 1). But what were other macro indicators saying? |
|
| Figure 1. Relative chart showing corporate business equities and liabilities to GDP showing peak in 2000, lower high in 2007, and still lower high in 2009. As of the latest data we see a recent hiccup for Q3 2021 down from a reading of 212 in Q2. |
| Graphic provided by: https://fred.stlouisfed.org/. |
| |
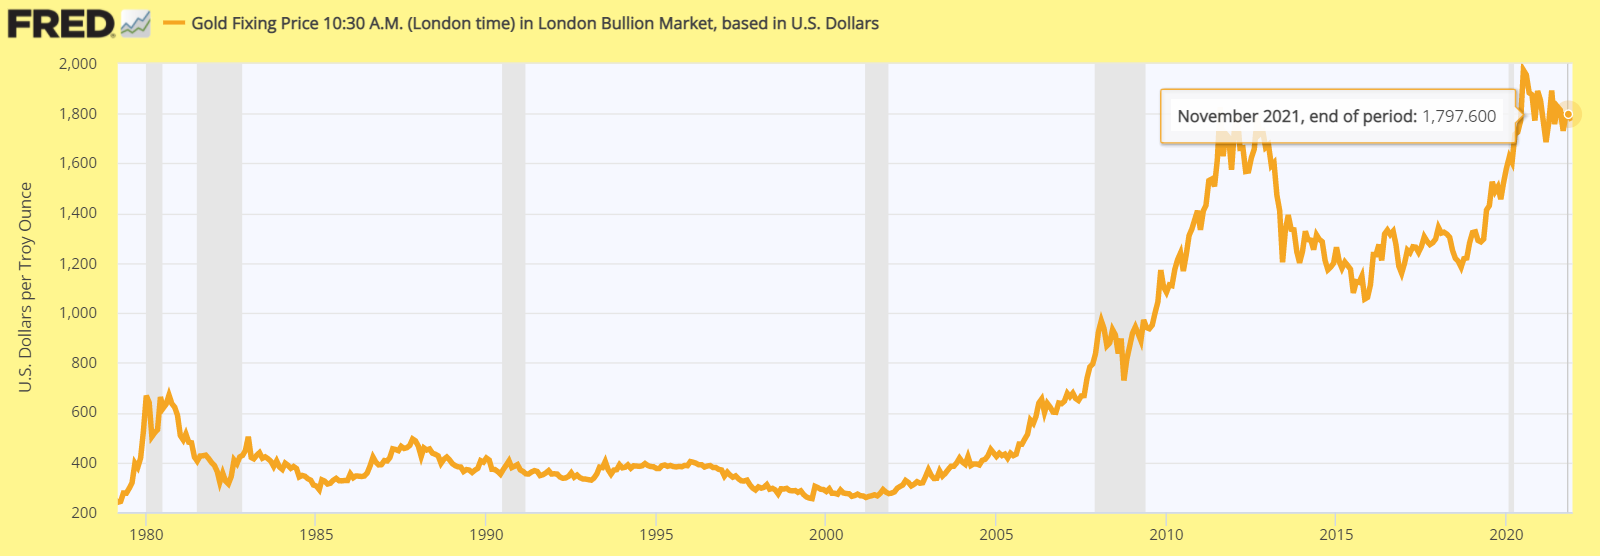
| Inflation fears gained increasing attention as consumer prices took off. The December 10 U.S. BLS report on the Consumer Price Index, showed that the all items index rose 6.8% for the preceding 12 months ending November, for the largest 12-month increase since June 1982. But while gold remained near previous highs, prices hadn't yet gone ballistic (see Figure 2). |
|
| Figure 2. Gold was back near its previous all time highs in December. After peaking in July 2020 at 1974.70/oz, it backed off somewhat to just above $1800. |
| Graphic provided by: https://fred.stlouisfed.org/. |
| |
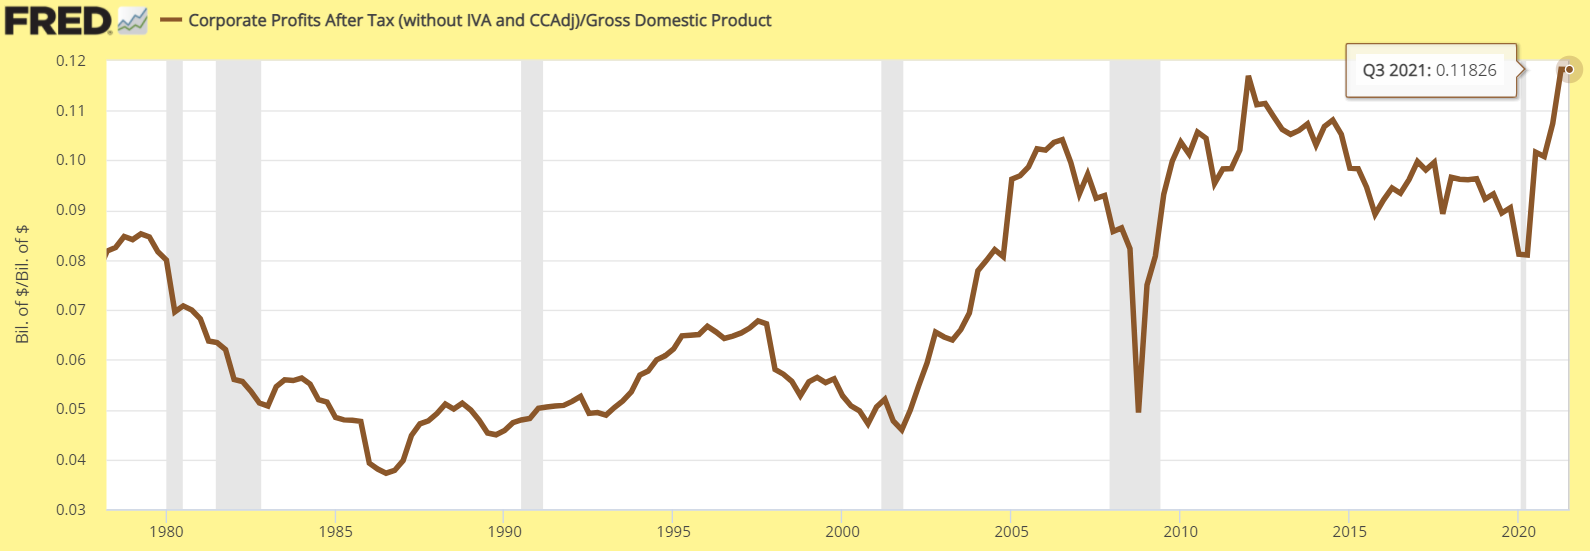
| However, it was clear why stocks were putting in new all-time highs. After taking a hit relative to the economy from 2013 into 2020, corporate after-tax profits surged to hit new highs in 2021. |
|
| Figure 3. Quarterly Fed data of US corporate profits divided by GDP. |
| Graphic provided by: https://fred.stlouisfed.org/. |
| |
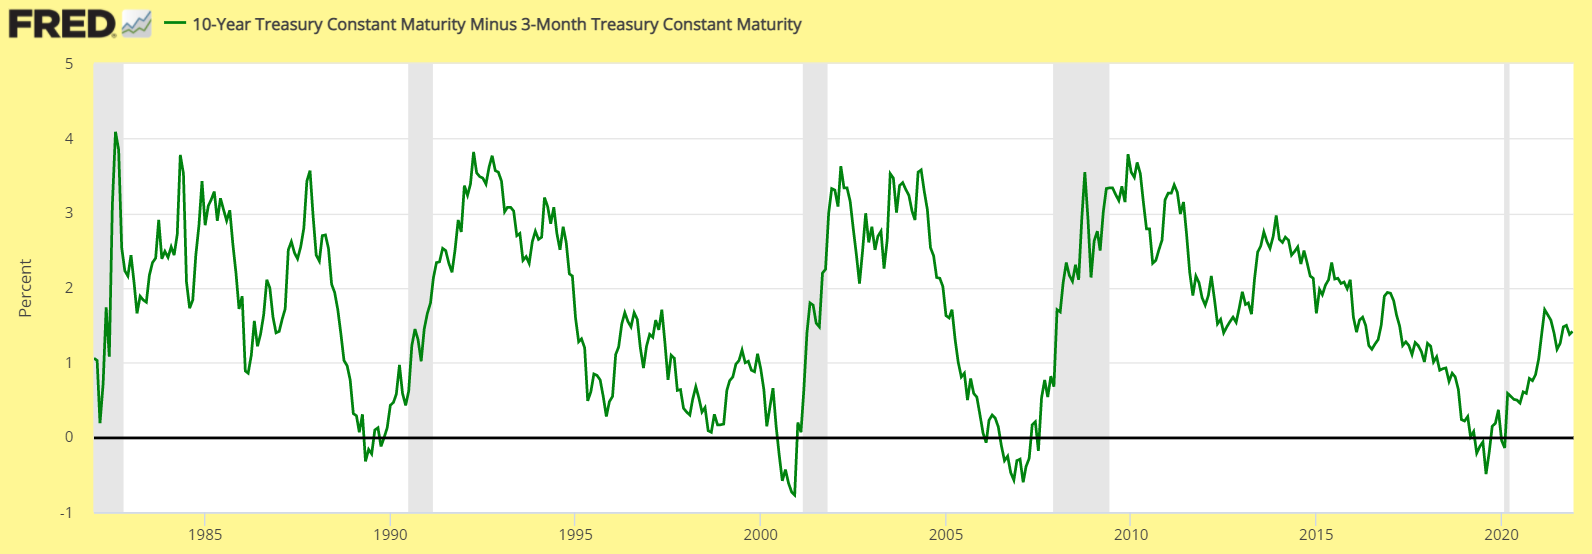
| So what was the Treasury yield curve saying? As we see in the next chart, 10-year minus 3-month yields which have provided useful warnings of a weakening economy in the past (see vertical grey bars), was still gaining altitude heading into 2022 indicating a relatively strong bond picture. |
|
| Figure 4. Chart of 10-year minus 3-month Treasury yields from 1982 to current. |
| Graphic provided by: https://fred.stlouisfed.org/. |
| |
But as well as rising inflation pressure and rising pandemic uncertainties, there were other clouds on the horizon. This last chart, brought to my attention by Ted Kavadas, author of the EconomicGreenfield blog (https://economicgreenfield.blogspot.com/) highlighted falling commercial and industrial loans as a sign of economic weakness.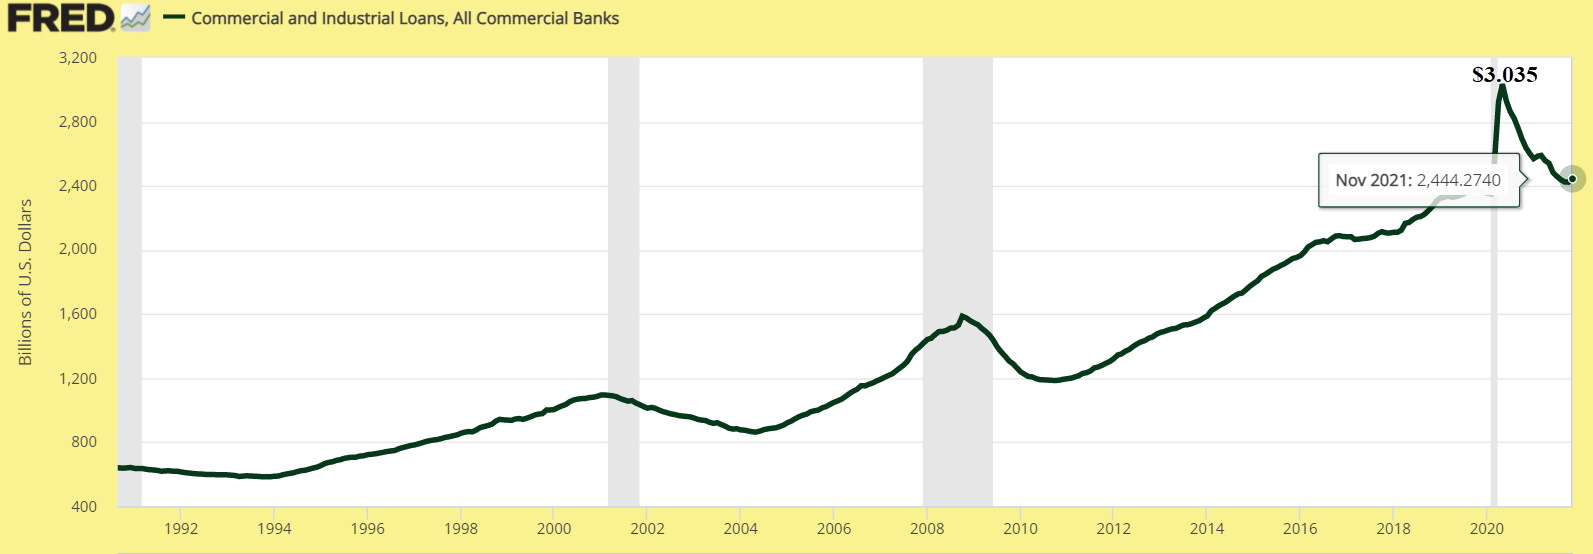 Figure 5. Commercial and Industrial Loans peaked in May 2020 at $3,035 billion and are down 16.6% by May 2021. To put this in perspective, the biggest drop in history from the previous year of 20.16% occurred between February 2009 and 2010. Tactical Takeaway So is the market in extreme overvalued territory as implied by the Buffett Indicator? Long-time Buffett partner and Berkshire Hathaway Vice Chairman certainly thinks so. "I just can't stand participating in these insane booms. There's no great company that can't be turned into a bad investment just by raising the price," he opined at a recent investment conference according to Yahoo Finance. No doubt investors will be watching the First-five day Indicator and January Barometers for further guidance. Both were bang on for predicting stock performance in January 2021! Suggested Reading: Buffett's Indicator CPI Update 'First five days' indicator, which has a solid track record at predicting year, off to good start. January Barometer |
Matt Blackman is a full-time technical and financial writer and trader. He produces corporate and financial newsletters, and assists clients in getting published in the mainstream media. Matt has earned the Chartered Market Technician (CMT) designation. Follow Matt on Twitter at www.twitter.com/RatioTrade
| Title: | Author |
| Company: | TradeSystemGuru |
| Address: | Box 2589 |
| Garibaldi Highlands, BC V0N1T0 | |
| Phone # for sales: | 6048989069 |
| E-mail address: | indextradermb@gmail.com |
Traders' Resource Links | |
| TradeSystemGuru has not added any product or service information to TRADERS' RESOURCE. | |
Click here for more information about our publications!
PRINT THIS ARTICLE

Request Information From Our Sponsors
- StockCharts.com, Inc.
- Candle Patterns
- Candlestick Charting Explained
- Intermarket Technical Analysis
- John Murphy on Chart Analysis
- John Murphy's Chart Pattern Recognition
- John Murphy's Market Message
- MurphyExplainsMarketAnalysis-Intermarket Analysis
- MurphyExplainsMarketAnalysis-Visual Analysis
- StockCharts.com
- Technical Analysis of the Financial Markets
- The Visual Investor
- VectorVest, Inc.
- Executive Premier Workshop
- One-Day Options Course
- OptionsPro
- Retirement Income Workshop
- Sure-Fire Trading Systems (VectorVest, Inc.)
- Trading as a Business Workshop
- VectorVest 7 EOD
- VectorVest 7 RealTime/IntraDay
- VectorVest AutoTester
- VectorVest Educational Services
- VectorVest OnLine
- VectorVest Options Analyzer
- VectorVest ProGraphics v6.0
- VectorVest ProTrader 7
- VectorVest RealTime Derby Tool
- VectorVest Simulator
- VectorVest Variator
- VectorVest Watchdog