

HOT TOPICS LIST
- MACD
- Fibonacci
- RSI
- Gann
- ADXR
- Stochastics
- Volume
- Triangles
- Futures
- Cycles
- Volatility
- ZIGZAG
- MESA
- Retracement
- Aroon
INDICATORS LIST
LIST OF TOPICS
PRINT THIS ARTICLE
by Matt Blackman
Since first inverting in March 2019, the 10-Year minus 3-Month has inverted yet again. What does it mean?
Position: N/A
Matt Blackman
Matt Blackman is a full-time technical and financial writer and trader. He produces corporate and financial newsletters, and assists clients in getting published in the mainstream media. Matt has earned the Chartered Market Technician (CMT) designation. Follow Matt on Twitter at www.twitter.com/RatioTrade
PRINT THIS ARTICLE
BULL/BEAR MARKET
Recession Watch - Yield Curve Turns Negative Again
03/05/20 04:08:34 PMby Matt Blackman
Since first inverting in March 2019, the 10-Year minus 3-Month has inverted yet again. What does it mean?
Position: N/A
| It's been nearly a year since the 10-Year minus 3-Month (10Y-3Mo) yield curve turned negative in March 2019, bounced back into positive territory, then turned back negative again in May. But after turning positive again in October, recession concerns seemed to abate. Often lost in the debate is that an inverted yield curve is advanced warning of a recession of anywhere from six months to 18 months. History has shown that each time the 10Y-3Mo yield curve inverted and stayed that way for at least a quarter, recession was a certainty according to data dating back to 1962 in warning of six recessions. |
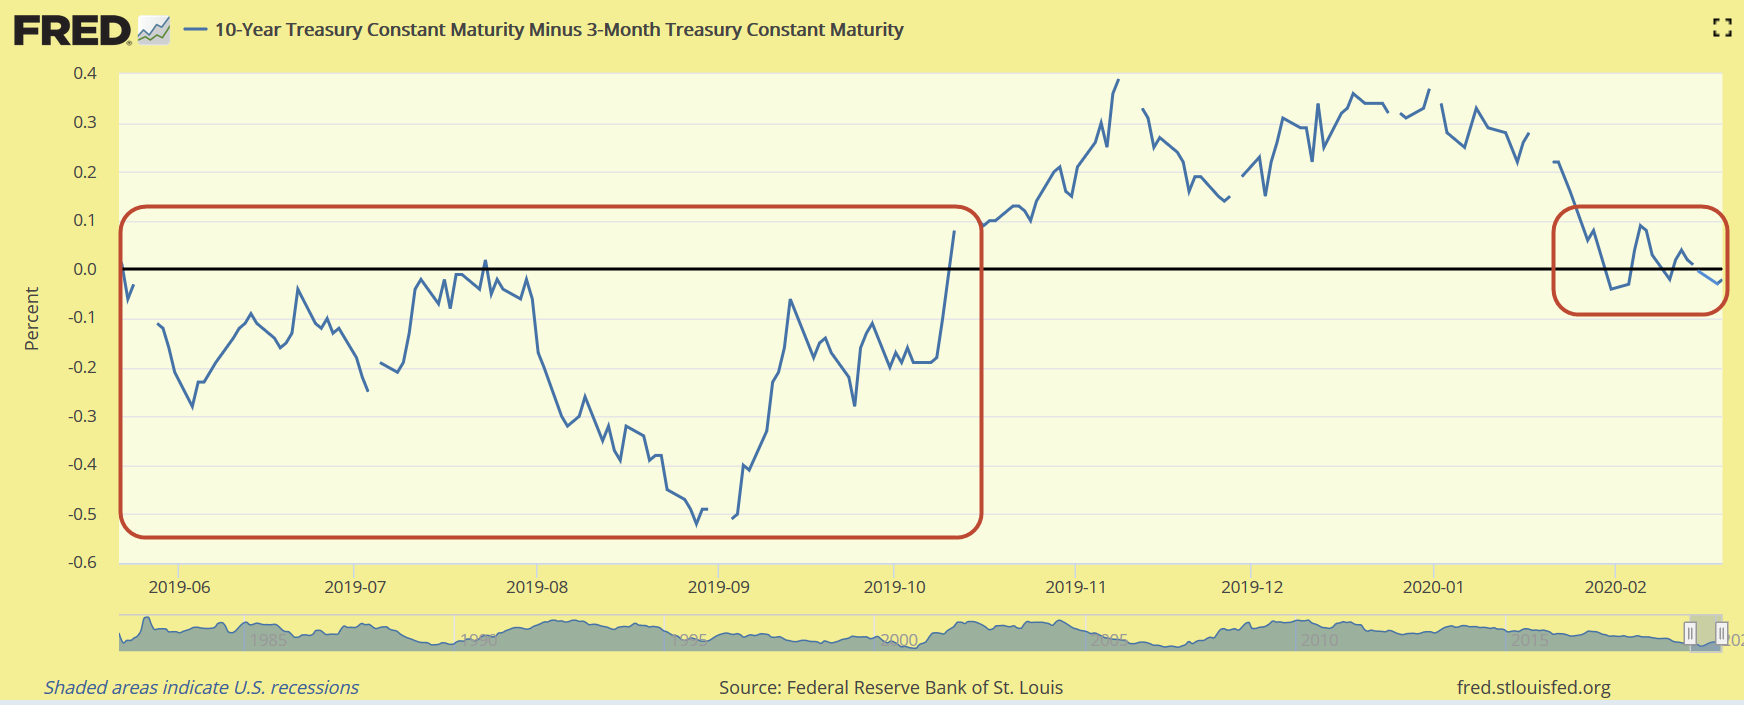
|
| Figure 1. Chart showing the 10-Year minus 3-Month curve first turning negative, bouncing into positive territory then turning negative again January 31, 2020. |
| Graphic provided by: Freestockcharts.com. |
| |
| So why is the yield curve a good indicator? In a strong economy short-term rates remain well below long-term, indicating strong demand for money to finance growth as the economy grows. Rates for short-term instruments such as 3-month Treasuries are lower than longer-term which investors borrow to finance riskier stocks. But as the economy cools and corporate earnings weaken, long-term rates drops as demand for money abates amid a slowing economy. And each time the 10-year rate drops below the 3-month, it signals weakness. It shows that investors are happy to accept lower long-term rates as priorities change from growth of principal to safety. And as we see in Figure 2, there are often multiple inversions leading up to recessions. |
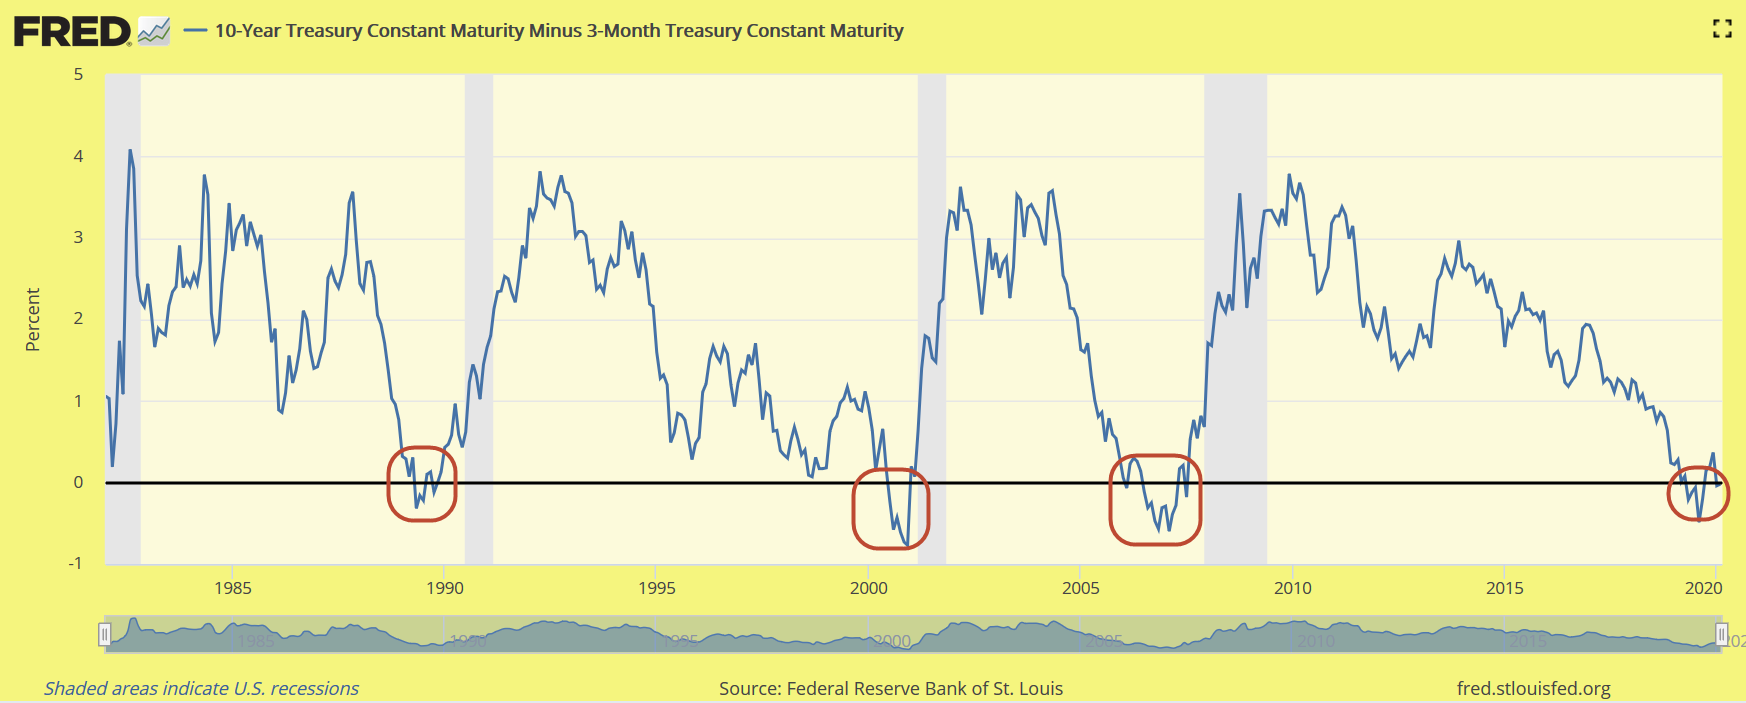
|
| Figure 2. Long-term chart of the 10-Year minus 3-Month yields with inversions circled in red. Grey vertical bands indicate recessions declared by the National Bureau of Economic Research (NBER) generally about a year after the recession hits markets. |
| Graphic provided by: Freestockcharts.com. |
| |
| Another reason to pay attention to the yield curve is that history also tells us that the longer yields are inverted, the longer the eventual recession. The big question on the minds of investors and traders these days is, will this time be different? |
| Suggested Reading: The Treasury Yield Curve Inverted Again - Should We Be Worried? Recession Watch 2020 - A Technical View Of Some Economic Data |
Matt Blackman is a full-time technical and financial writer and trader. He produces corporate and financial newsletters, and assists clients in getting published in the mainstream media. Matt has earned the Chartered Market Technician (CMT) designation. Follow Matt on Twitter at www.twitter.com/RatioTrade
| Title: | Author |
| Company: | TradeSystemGuru |
| Address: | Box 2589 |
| Garibaldi Highlands, BC V0N1T0 | |
| Phone # for sales: | 6048989069 |
| E-mail address: | indextradermb@gmail.com |
Traders' Resource Links | |
| TradeSystemGuru has not added any product or service information to TRADERS' RESOURCE. | |
Click here for more information about our publications!
PRINT THIS ARTICLE

Request Information From Our Sponsors
- StockCharts.com, Inc.
- Candle Patterns
- Candlestick Charting Explained
- Intermarket Technical Analysis
- John Murphy on Chart Analysis
- John Murphy's Chart Pattern Recognition
- John Murphy's Market Message
- MurphyExplainsMarketAnalysis-Intermarket Analysis
- MurphyExplainsMarketAnalysis-Visual Analysis
- StockCharts.com
- Technical Analysis of the Financial Markets
- The Visual Investor
- VectorVest, Inc.
- Executive Premier Workshop
- One-Day Options Course
- OptionsPro
- Retirement Income Workshop
- Sure-Fire Trading Systems (VectorVest, Inc.)
- Trading as a Business Workshop
- VectorVest 7 EOD
- VectorVest 7 RealTime/IntraDay
- VectorVest AutoTester
- VectorVest Educational Services
- VectorVest OnLine
- VectorVest Options Analyzer
- VectorVest ProGraphics v6.0
- VectorVest ProTrader 7
- VectorVest RealTime Derby Tool
- VectorVest Simulator
- VectorVest Variator
- VectorVest Watchdog