HOT TOPICS LIST
- MACD
- Fibonacci
- RSI
- Gann
- ADXR
- Stochastics
- Volume
- Triangles
- Futures
- Cycles
- Volatility
- ZIGZAG
- MESA
- Retracement
- Aroon
INDICATORS LIST
LIST OF TOPICS
PRINT THIS ARTICLE
by Matt Blackman
Right out of the gate, the going got tough for stocks this year. But where do they go from here?
Position: N/A
Matt Blackman
Matt Blackman is a full-time technical and financial writer and trader. He produces corporate and financial newsletters, and assists clients in getting published in the mainstream media. Matt has earned the Chartered Market Technician (CMT) designation. Follow Matt on Twitter at www.twitter.com/RatioTrade
PRINT THIS ARTICLE
2022 Off To A Rough Start
02/03/22 04:37:51 PMby Matt Blackman
Right out of the gate, the going got tough for stocks this year. But where do they go from here?
Position: N/A
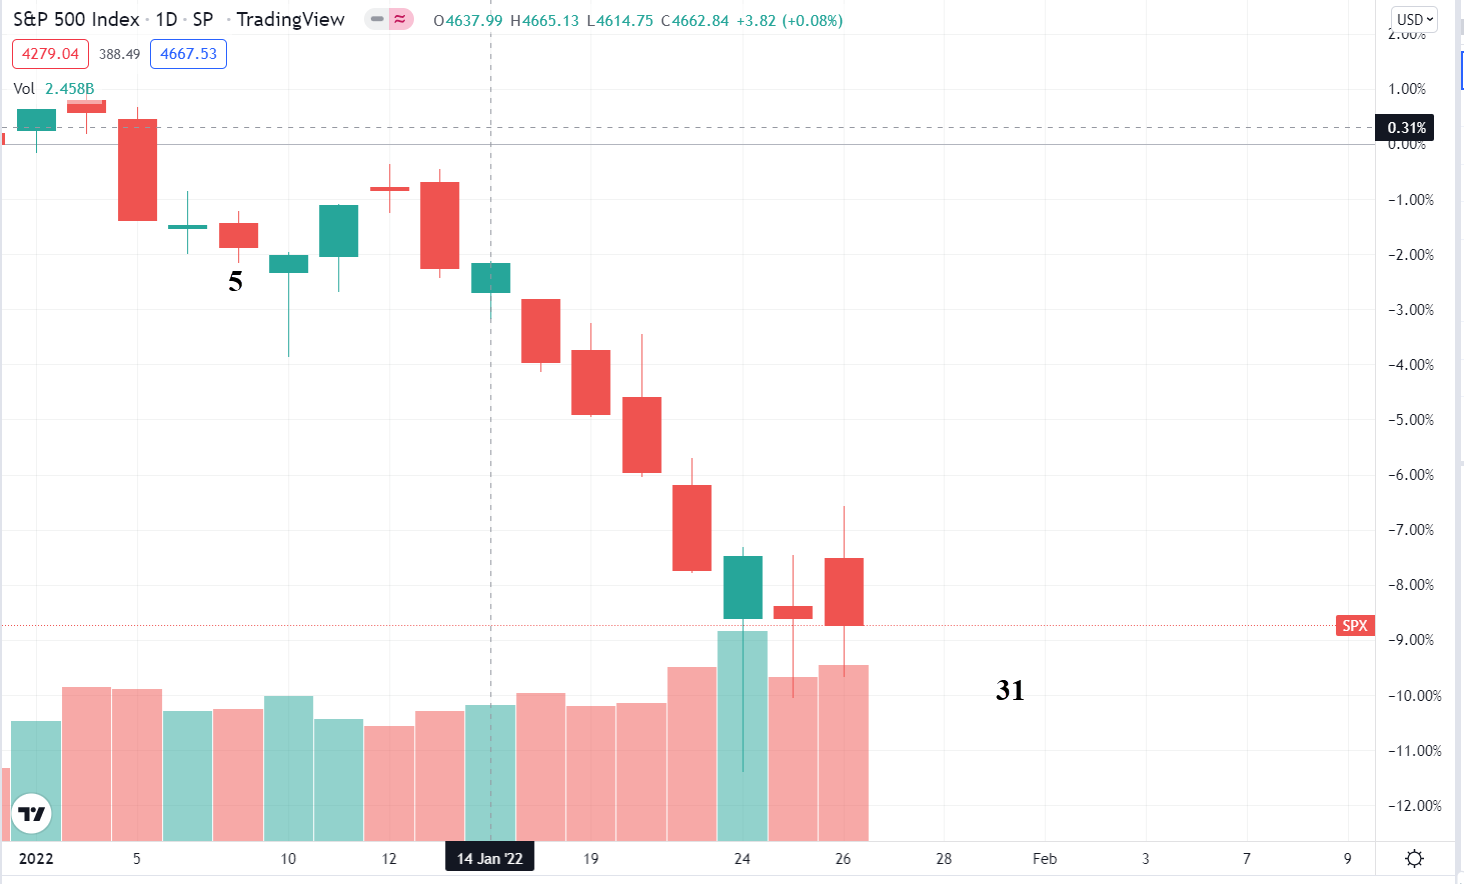
| Many traders like to watch two year-opener indicators to gauge what the year may have in store: the First Five Day and the January Barometer. In a nutshell, these indicators imply that the first month of the year has implications for how the rest of the year will unroll (see 'As Goes January'). And yes, there were reasons for concern after the first five trading days with the S&P500 Index off 2%. But then things only got worse from there. Coming into the last week of January, the SPX had lost 9% and there were scant signs that it would get better anytime soon. |

|
| Figure 1. Daily chart of the S&P 500 Index for 2022 to January 26. |
| Graphic provided by: TradingView. |
| |
| From a broad market perspective, only energy made gains early on with the sector rising an average of 13.11% from December 31, 2021. Not surprisingly given their strong performance in 2021, Technology was the hardest hit losing an average of 16% to January 26. |

|
| Figure 2. Sector performance for the first part of 2022. |
| Graphic provided by: https://finviz.com/. |
| |
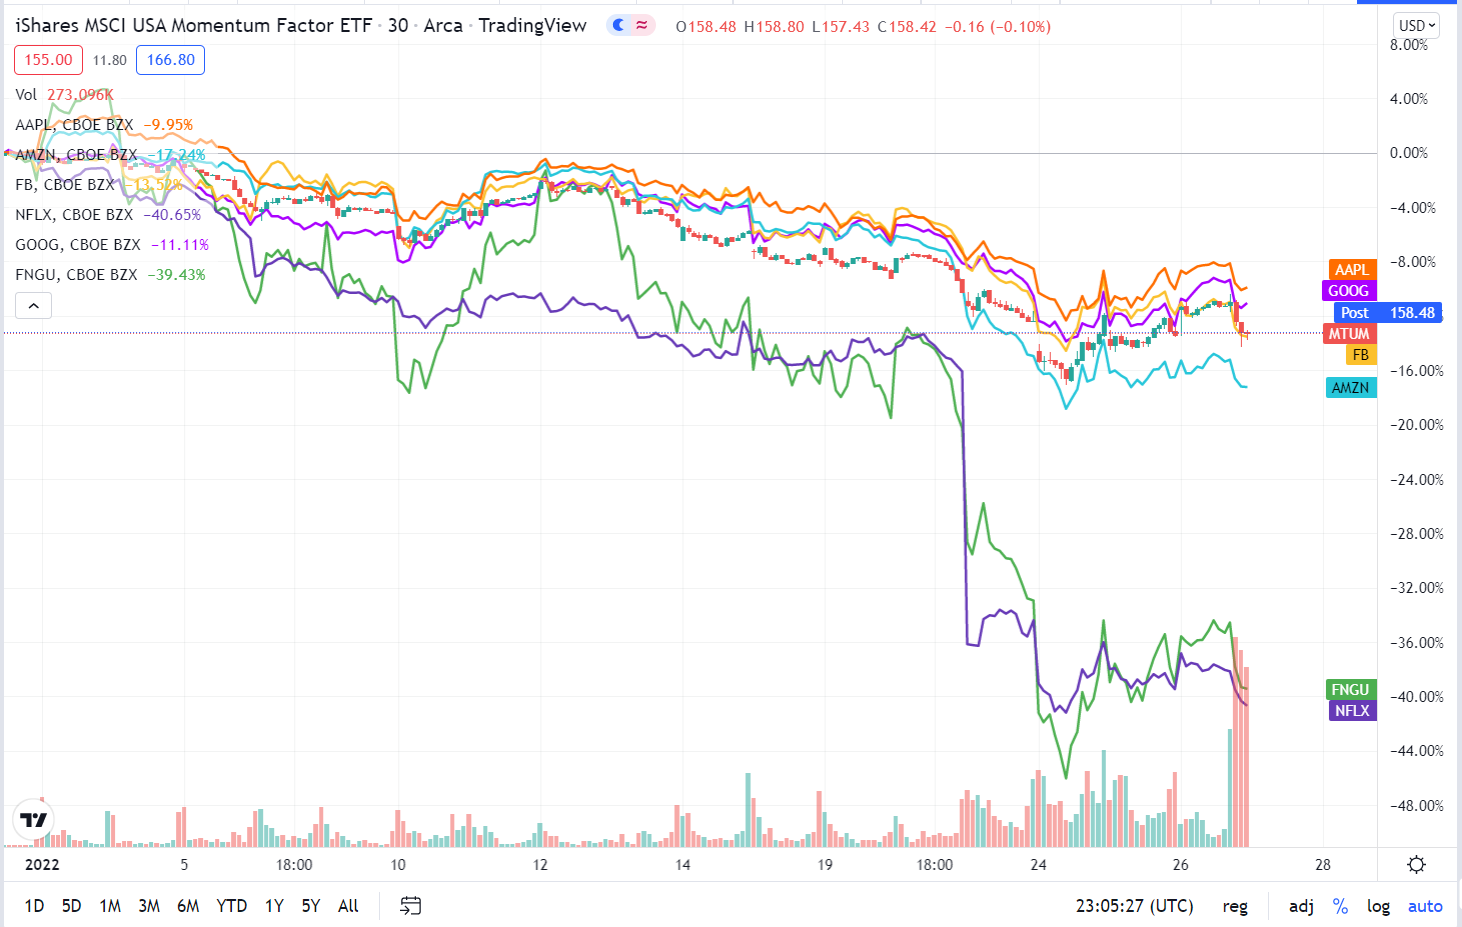
| But it was only when taking a closer look at the prior star performers was the scope of the damage truly visible, as we see in Figure 3, with the chart of FAANG (FB, AAPL, AMZN, NFLX, GOOG). One stock, leverage ETN (3 to 1) symbol FNGU, lost nearly 40%! And as we see from the next chart AAPL fared better than the other techs losing slightly less than 10%. Worst hit, NFLX lost more than 40%. |

|
| Figure 3. 30-minute chart of the FAANG stocks (plus MTUM) showing early 2022 performance to January 26 |
| Graphic provided by: TradingView. |
| |
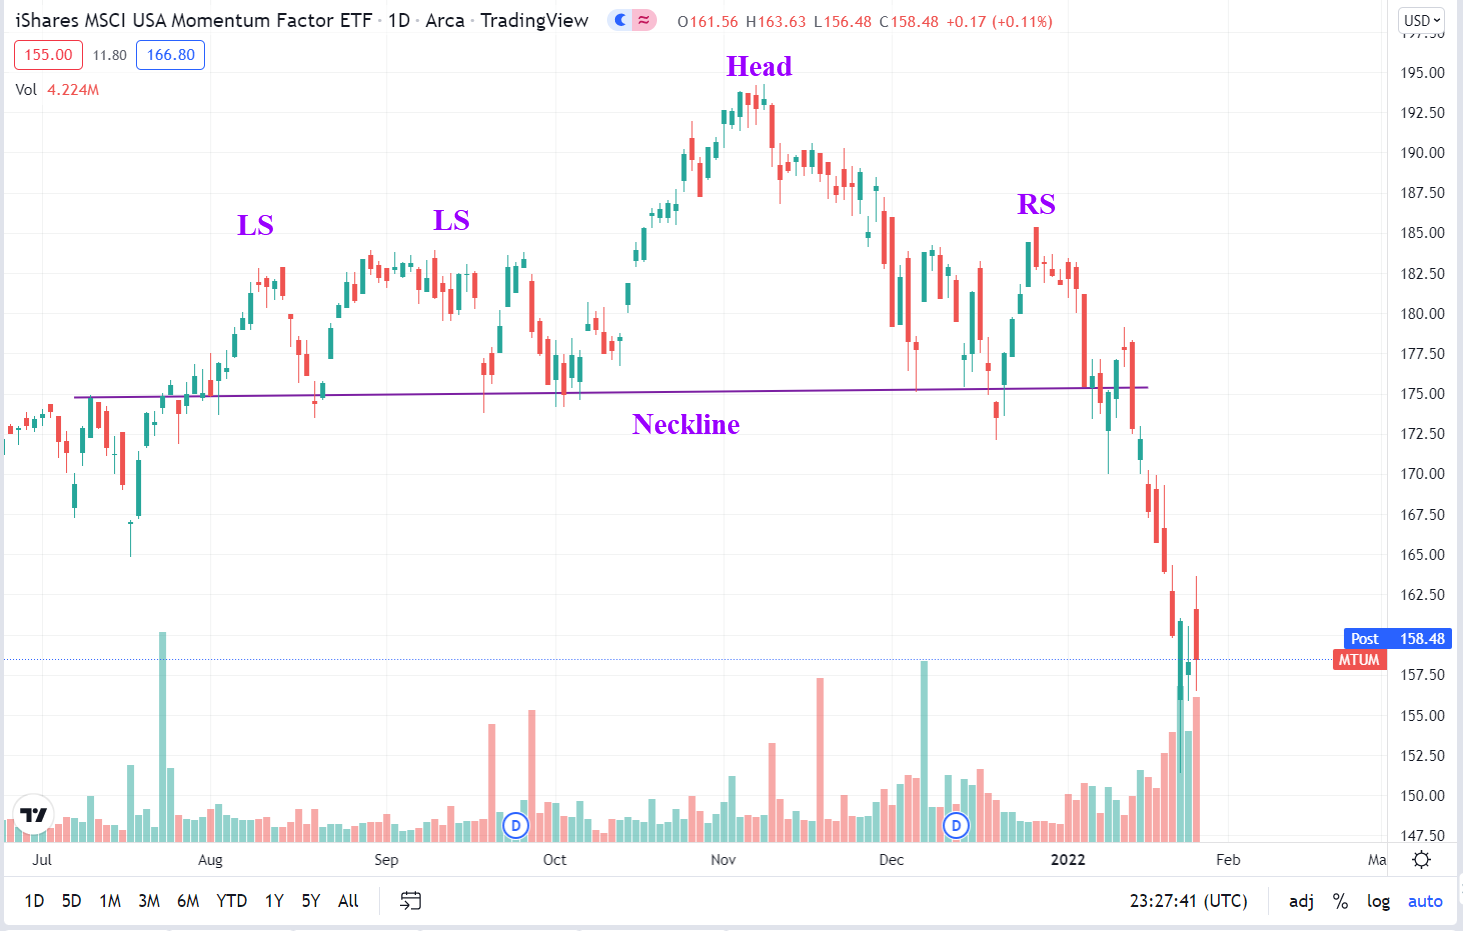
| The Bear Pressing? Technically a bear market is said to have arrived when major indices drop 20% or more, so from the perspective of the SPX, we are roughly half way there. Now traders will be scanning for more bear patterns that will provide technical warnings that stocks are indeed under increasing pressure. One clear example of that is the iShares MSCI USA Momentum Factor ETF (MTUM) which is a composite of high momentum stocks that provide a useful indication of market leading stocks. It confirmed a Bearish Head & Shoulders pattern on January 13 with a decisive breach of the pattern neckline around 175 (see Figure 4). As discussed January 13 ('Buffett Indicator Takes a Pause'), stocks have been stretched like never before in history so a correction is certainly not a long-shot. The question is, are we experiencing a short, sharp pause or something more sustained? |

|
| Figure 4. Daily chart of the iShares MSCI USA Momentum Factor ETF (MTUM) showing a two left-shouldered H&S with breach of the pattern neckline which had already hit its first minimum projected target of 158 by January 24. |
| Graphic provided by: TradingView. |
| |
| Suggested Reading: As Goes January... Buffett Indicator Takes a Pause |
Matt Blackman is a full-time technical and financial writer and trader. He produces corporate and financial newsletters, and assists clients in getting published in the mainstream media. Matt has earned the Chartered Market Technician (CMT) designation. Follow Matt on Twitter at www.twitter.com/RatioTrade
| Title: | Author |
| Company: | TradeSystemGuru |
| Address: | Box 2589 |
| Garibaldi Highlands, BC V0N1T0 | |
| Phone # for sales: | 6048989069 |
| E-mail address: | indextradermb@gmail.com |
Traders' Resource Links | |
| TradeSystemGuru has not added any product or service information to TRADERS' RESOURCE. | |
Click here for more information about our publications!
Comments

|

Request Information From Our Sponsors
- StockCharts.com, Inc.
- Candle Patterns
- Candlestick Charting Explained
- Intermarket Technical Analysis
- John Murphy on Chart Analysis
- John Murphy's Chart Pattern Recognition
- John Murphy's Market Message
- MurphyExplainsMarketAnalysis-Intermarket Analysis
- MurphyExplainsMarketAnalysis-Visual Analysis
- StockCharts.com
- Technical Analysis of the Financial Markets
- The Visual Investor
- VectorVest, Inc.
- Executive Premier Workshop
- One-Day Options Course
- OptionsPro
- Retirement Income Workshop
- Sure-Fire Trading Systems (VectorVest, Inc.)
- Trading as a Business Workshop
- VectorVest 7 EOD
- VectorVest 7 RealTime/IntraDay
- VectorVest AutoTester
- VectorVest Educational Services
- VectorVest OnLine
- VectorVest Options Analyzer
- VectorVest ProGraphics v6.0
- VectorVest ProTrader 7
- VectorVest RealTime Derby Tool
- VectorVest Simulator
- VectorVest Variator
- VectorVest Watchdog
