HOT TOPICS LIST
- MACD
- Fibonacci
- RSI
- Gann
- ADXR
- Stochastics
- Volume
- Triangles
- Futures
- Cycles
- Volatility
- ZIGZAG
- MESA
- Retracement
- Aroon
INDICATORS LIST
LIST OF TOPICS
PRINT THIS ARTICLE
by Mark Rivest
A study of potential alternate wave counts.
Position: N/A
Mark Rivest
Independent investment advisor, trader and writer. He has written articles for Technical Analysis of Stocks & Commodities, Traders.com Advantage,Futuresmag.com and, Finance Magnates. Author of website Four Dimension Trading.
PRINT THIS ARTICLE
ELLIOTT WAVE
Elliott Wave Crossroads - Part Two
05/29/20 02:35:43 PMby Mark Rivest
A study of potential alternate wave counts.
Position: N/A
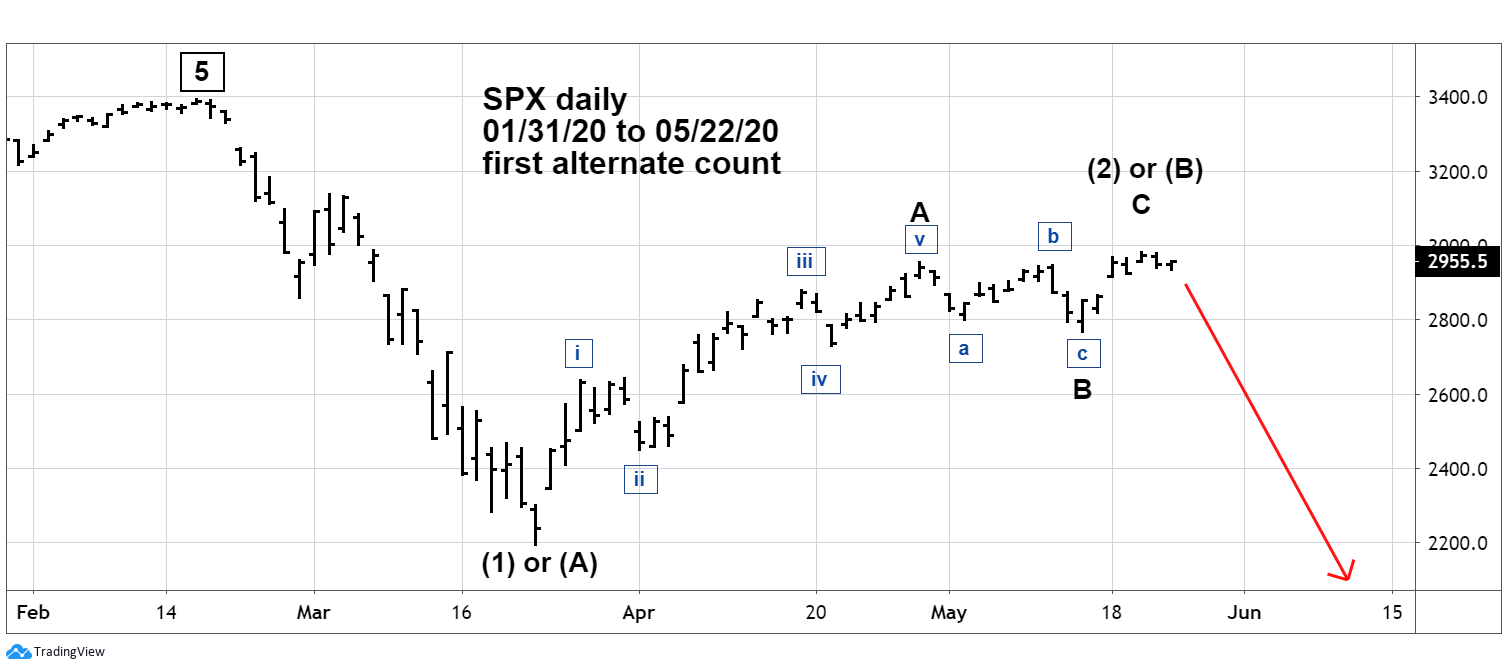
| Analysts using Elliott Wave theory seek to discover a market's most likely path, referred to as the primary wave count. Markets represent the mass mind and, like individuals, can change direction. No matter how clear a primary count is, analysts need to be prepared for alternate paths. Since March 23, the S&P 500 (SPX) has been in a powerful rally and the primary Elliott wave count implies the rally could continue for several months. Knowledge of alternate Elliott wave counts can prepare traders/analysts for what could happen should the SPX begin to decline. S&P 500 - First Alternate Wave Count The SPX rally from March 23 to April 29 took the form of a clear five-wave Elliott Wave pattern which was illustrated in my May 11 article "How to use Elliott Wave Theory with Individual Stocks". Subsequently the SPX declined in a clear three - wave Elliott pattern, noted in my May 20 article "Elliott Wave Crossroads". Shortly afterwards the SPX resumed the rally and exceeded its April 29 high. From a strictly Elliott wave perspective this upside breakthrough implies another five-wave rally proportionately in size with the March to April movement. However, there are other paths the SPX could take. Please see the first alternate SPX wave count illustrated in Figure 1. This count shows that a three-wave correction of the February to March crash is complete and the SPX could be on a path to break below its March 23rd bottom. The supposed wave "C" of the rally from March 23rd is much smaller than the supposed wave "A" which makes this a low probable wave count. The typical Fibonacci relationships of wave "C" to "A" are .618 or equality. Additionally, my April 2 article "The Bull is Dead, Long Live the Bull" noted a powerful bullish momentum signal which puts this bearish alternate count in doubt. |

|
| Figure 1. This count shows that a three-wave correction of the February to March crash is complete and the SPX could be on a path to break below its March 23 bottom. |
| Graphic provided by: tradingview.com. |
| |
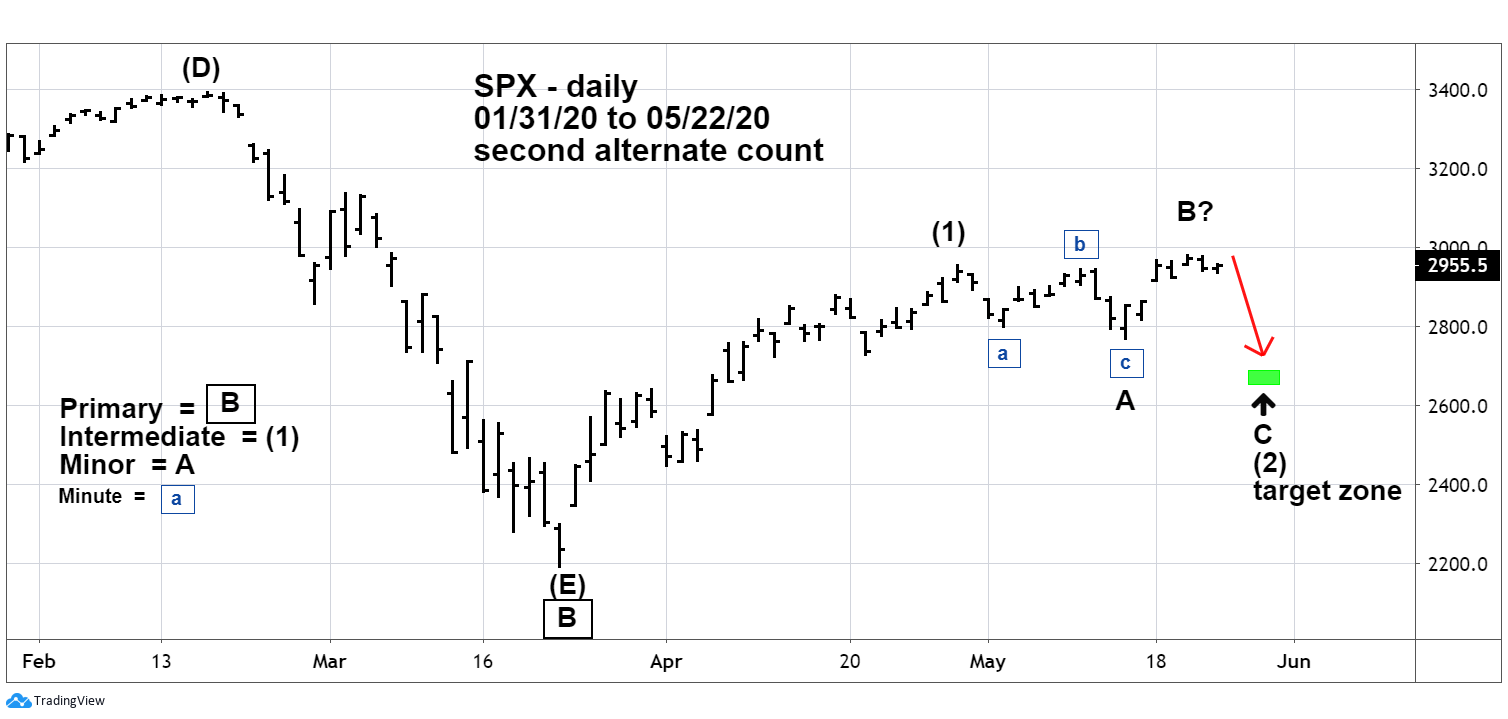
| S&P 500 - Second Alternate Count A less bearish SPX alternate count is illustrated in Figure 2. The SPX from its April 29 peak could be forming an Elliott Wave Expanding Flat correction. The first part of this pattern is in three waves and begins after the termination point of a five-wave pattern. The second part also is a three-wave movement that marginally exceeds the termination point of the five-wave pattern. The third and final phase is a five-wave movement that marginally exceeds the termination point of the first part of the Expanding Flat. If an Expanding Flat is in formation, the supposed Minor wave "B", the second phase of the correction, may have further to travel. The most likely Fibonacci relationship of wave "B" to "A" within Expanding Flats is 1.236. On May 20, the supposed Minor wave "B" reached SPX 2980.30. The supposed Minor wave "A" length was 188.30 points x 1.236 = 232.70 added to the wave "A" termination point 2766.6 targets SPX 2999.30, near round number resistance of 3000. If an Expanding Flat is forming it could terminate somewhere in the upper 2600 area. |

|
| Figure 2. If an Expanding Flat is forming it could terminate somewhere in the upper 2600 area. |
| Graphic provided by: tradingview.com. |
| |
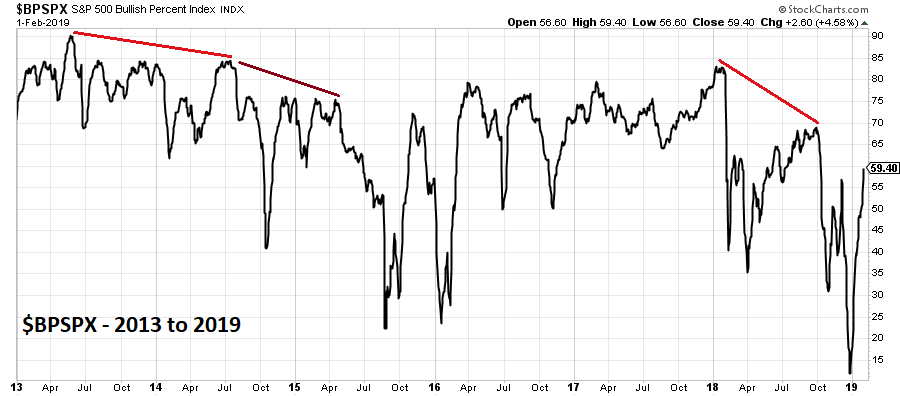
| Bullish Percentage Index - 2013 to 2019 The best way to determine which could be the correct wave count is to gather evidence from the dimensions of momentum and sentiment. One of the best stock market momentum indicators is the Bullish Percent Index which measures the percentage of stocks within an index that are on Point & Figure buy signals. Please see the SPX - Bullish Percent Index ($BPSPX) 2013 to 2019 chart illustrated in Figure 3. Prior to 2020, the two most significant SPX tops were made in May 2015 and September 2018. Note that the maximum $BPSPX reading occurred in mid-2013 nearly two years before the SPX top. Additionally, there was a double bearish divergence vs. the SPX. The maximum $BPSPX reading for the SPX bull phase that began in early 2016 came in January 2018. The next significant SPX top didn't happen until September 2018 — eight months after the maximum $BPSPX reading. The Bullish Percent Index illustrates the slow rounding tops of stock bull markets. Contrary to popular opinion stock bull markets end with a whimper not with a bang. |

|
| Figure 3. The Bullish Percent Index illustrates the slow rounding tops of stock bull markets. |
| Graphic provided by: StockCharts.com. |
| |
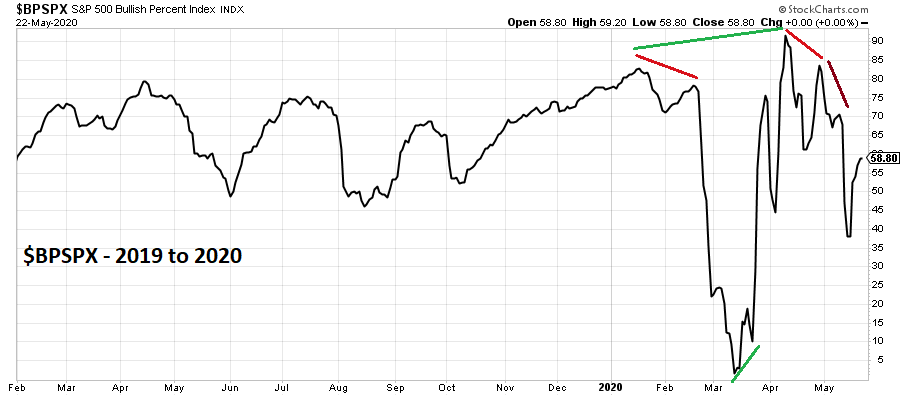
| Bullish Percent Index - 2019 to 2020 Please see the $BPSPX - 2019 to 2020 chart illustrated in Figure 4. In January 2020 something very unusual happened, $BPSPX reached its highest level of the bull phase that began in December 2018. Just one moth later the SPX made a significant top, then crashed. The reason — reaction to the Coronavirus crisis; just prior to the crisis the US had the strongest economy in fifty years. Unlike the normal slowing of an economic expansion, a significant portion of the US economy was brought to a screeching halt. $BPSPX crashed into mid-May, then had a bullish divergence at the SPX May 23 bottom. The subsequent powerful $BPSPX rally pushed it above its January 2020 high implying that the SPX could rally above its February 2020 top. $BPSPX as of May 22, has a double bearish divergence vs. the SPX May 20 rally high. While this is potentially bearish for the SPX, it goes against history that suggests SPX could continue to rise for at least eight months after a $BPSPX momentum high. |

|
| Figure 4. $BPSPX crashed into mid-May, then had a bullish divergence at the SPX May 23 bottom. |
| Graphic provided by: StockCharts.com. |
| |
| Choosing The Correct Path US stocks are seasonally bearish from May until at least June. The two-week SPX correction that ended on May 14, with daily momentum indicators failing to reach oversold levels implies near-term down-side potential. These two factors favor an Expanding Flat correction being under construction. If the SPX declines early to mid-June and reaches the upper 2600 area with daily momentum indicators oversold, it could be a tremendous opportunity to enter long positions. Analysts/traders always need to be wary of falling in love with a forecast, at any time markets can change direction. To stay on the correct path, monitor momentum/sentiment indicators for confirmation/non-conformation of market movements. Additionally, knowledge of Fibonacci relationships among the waves can give clues of direction probabilities. Further Reading: Frost A.J and Robert Prechter (1985) "Elliott Wave Principle", New Classics Library. |
Independent investment advisor, trader and writer. He has written articles for Technical Analysis of Stocks & Commodities, Traders.com Advantage,Futuresmag.com and, Finance Magnates. Author of website Four Dimension Trading.
| Website: | www.fourdimensiontrading.com |
| E-mail address: | markrivest@gmail.com |
Click here for more information about our publications!
PRINT THIS ARTICLE

Request Information From Our Sponsors
- StockCharts.com, Inc.
- Candle Patterns
- Candlestick Charting Explained
- Intermarket Technical Analysis
- John Murphy on Chart Analysis
- John Murphy's Chart Pattern Recognition
- John Murphy's Market Message
- MurphyExplainsMarketAnalysis-Intermarket Analysis
- MurphyExplainsMarketAnalysis-Visual Analysis
- StockCharts.com
- Technical Analysis of the Financial Markets
- The Visual Investor
- VectorVest, Inc.
- Executive Premier Workshop
- One-Day Options Course
- OptionsPro
- Retirement Income Workshop
- Sure-Fire Trading Systems (VectorVest, Inc.)
- Trading as a Business Workshop
- VectorVest 7 EOD
- VectorVest 7 RealTime/IntraDay
- VectorVest AutoTester
- VectorVest Educational Services
- VectorVest OnLine
- VectorVest Options Analyzer
- VectorVest ProGraphics v6.0
- VectorVest ProTrader 7
- VectorVest RealTime Derby Tool
- VectorVest Simulator
- VectorVest Variator
- VectorVest Watchdog
