

HOT TOPICS LIST
- MACD
- Fibonacci
- RSI
- Gann
- ADXR
- Stochastics
- Volume
- Triangles
- Futures
- Cycles
- Volatility
- ZIGZAG
- MESA
- Retracement
- Aroon
INDICATORS LIST
LIST OF TOPICS
PRINT THIS ARTICLE
by Mark Rivest
Tesla and Apple have clear Elliott Wave patterns.
Position: N/A
Mark Rivest
Independent investment advisor, trader and writer. He has written articles for Technical Analysis of Stocks & Commodities, Traders.com Advantage,Futuresmag.com and, Finance Magnates. Author of website Four Dimension Trading.
PRINT THIS ARTICLE
ELLIOTT WAVE
How To Use Elliott Wave Theory With Individual Stocks
05/11/20 03:03:09 PMby Mark Rivest
Tesla and Apple have clear Elliott Wave patterns.
Position: N/A
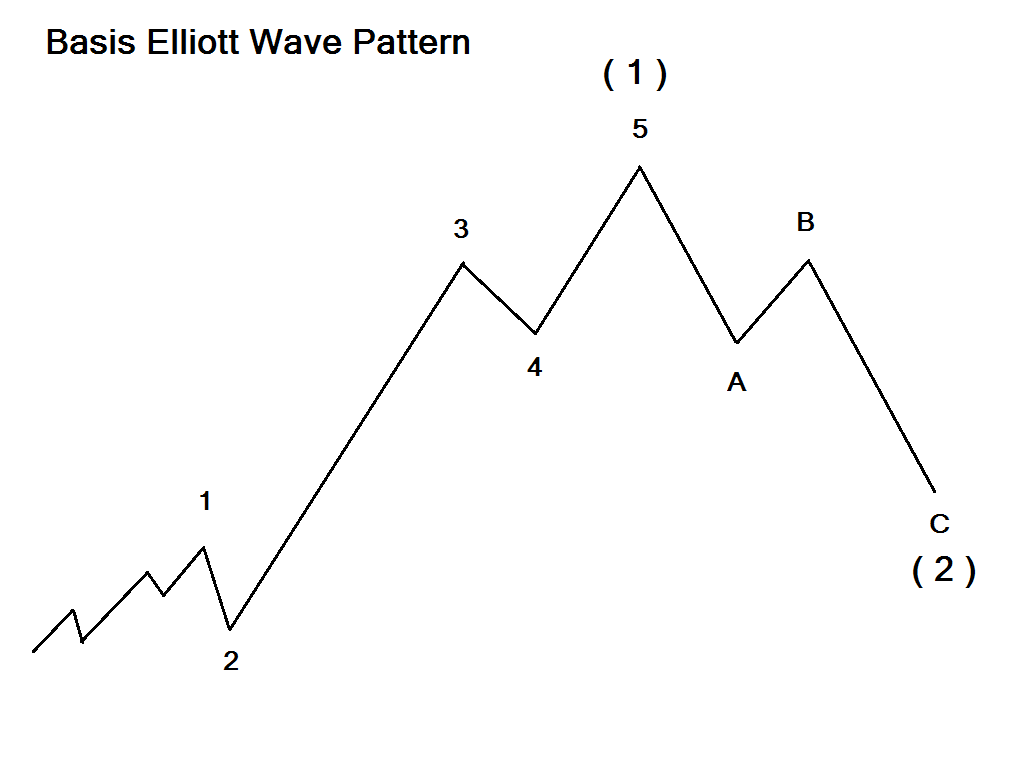
| The Elliott Wave theory reflects the progress of the mass mind and is illustrated best in stock market indices, however Elliott patterns can appear in other areas. Elliott Waves can appear in commodities, currencies, bonds and individual stocks. Since the late March stock market crash bottom two US company stocks have developed clear Elliott Wave patterns. These stocks may soon have very favorable risk/reward opportunities, and act as a guide for timing the broader US stock market. Basic Pattern There are thirteen different Elliott Wave patterns and three main rules. The scope of this article focuses on the basic pattern. For a more detailed examination of Elliott Wave theory please read "Elliott Wave Principle" by Frost and Prechter. Please see the basic pattern illustrated in Figure 1. Progress of the primary trend consists of five waves followed by three corrective waves. These represent the first and second waves of a larger developing structure. This concept is illustrated in wave "1" which is a smaller version of the main structure. Waves (1,3 and 5) are referred to as motive waves. Most of the time you will be able to see the smaller subdivision on only one of the motive waves. The subdivisions of the other two motive waves can be seen on a smaller time scale. If this illustration were a daily chart, the subdivisions of motive waves "3" and "5" could be viewed on an hourly chart. After completion of a five wave pattern the subsequent correction is usually in proportion by time and price. For example, if the illustrated five waves up to took six weeks, the correction could last for three weeks. The most common price retracements are Fibonacci ratios of .382 and .618. |
|
| Figure 1. Progress of the primary trend consists of five waves followed by three corrective waves. |
| Graphic provided by: Mark Rivest. |
| |
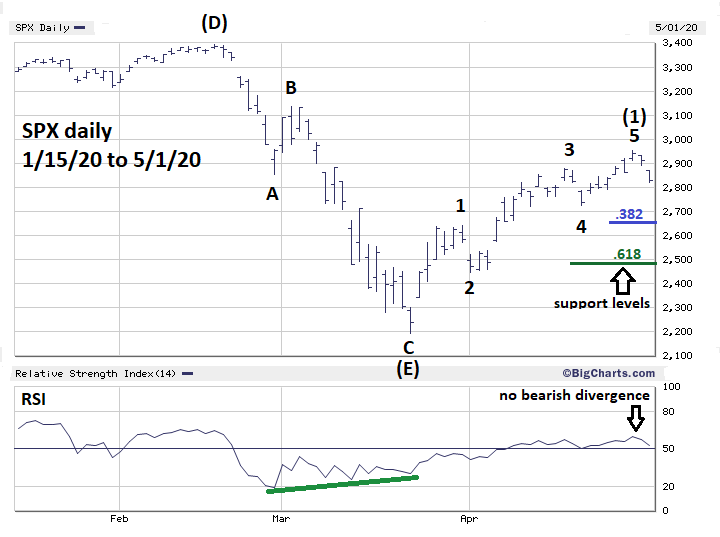
| S&P 500 Please see the daily S&P 500 (SPX) chart illustrated in Figure 2. The SPX progress from the March 23 crash bottom has taken the form of the basic Elliott five wave pattern. The rally high on April 29 was at 2954, within leeway of a Fibonacci .618 retracement at 2934. Also note the SPX reached overhead resistance, which is the area of the supposed wave "B" 2855 to 3136. If a near-term peak is in place the most likely path to support would be a three-wave correction. Support could come at or near 2665 which is a .382 retrace of the five-wave rally. SPX 2485 is a .618 retracement and is in the area of prior chart support. Additionally, a decline from the April 29 top would be wave (2) of a possible larger developing five wave patterns. Typically wave "twos" retrace at least .618 of wave "ones". The 2485 area is the most likely target for wave (2). Note the significant bullish RSI divergence at the March 23 bottom. The April 29 top had no bearish divergence and implies sometime in the near future this high could be exceeded. |
|
| Figure 2. If a near-term peak is in place the most likely path to support would be a three wave correction. |
| Graphic provided by: BigCharts.com. |
| |
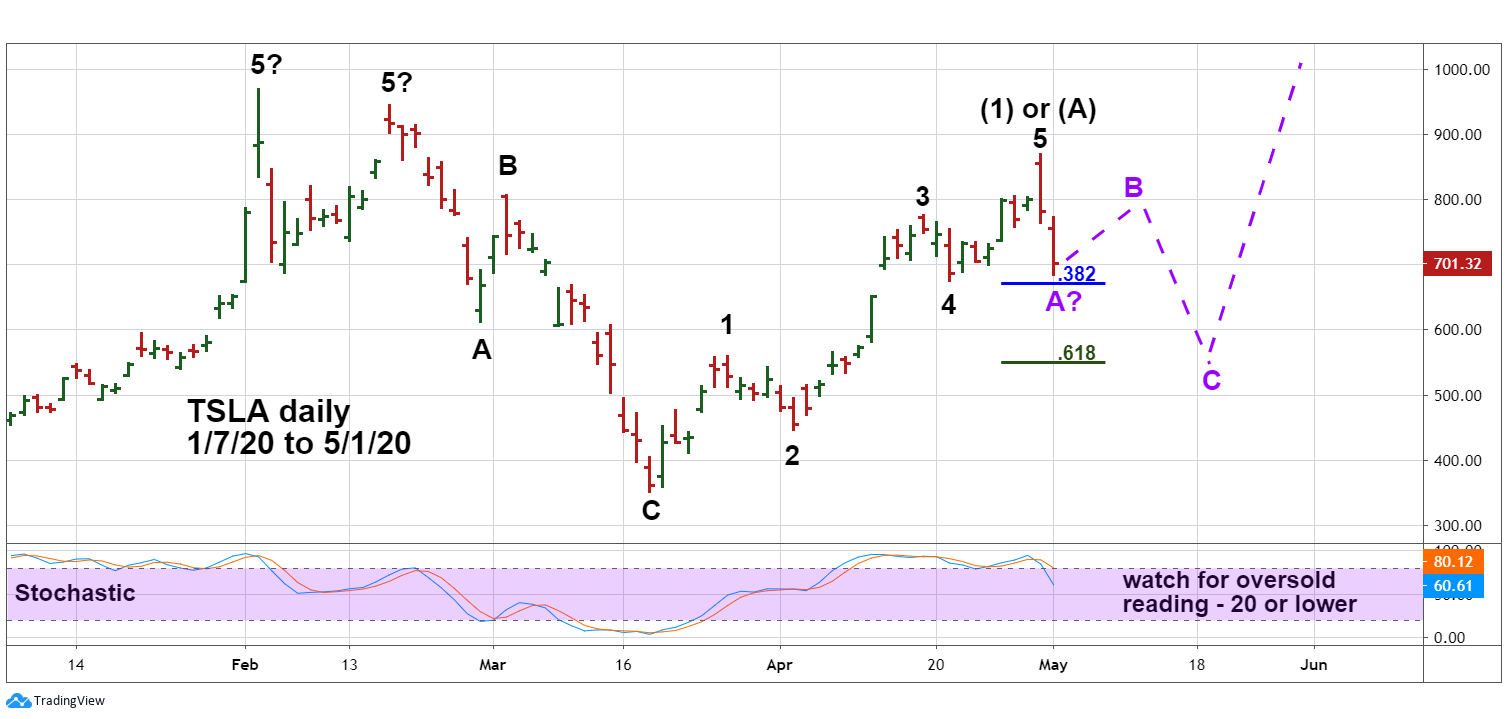
| Tesla Inc. The most likely individual stocks to have Elliott Wave patterns are large capitalized companies that easily follow the broader market. Tesla Inc. (TSLA), while not gigantic, does have intense speculative interest on both the bull and bear side which is probably a factor in its clear Elliott pattern. Please see the daily TSLA chart illustrated in Figure 3. My April 30 article "Follow the Leader" discussed going long on stocks outperforming the broader market. Note TSLA bottomed on March 18 three trading days before the SPX crash bottom on March 23. Subsequently, TSLA has retraced more than 80% of its decline vs. the SPX 63% retrace. TSLA is clearly outperforming the broader market and definitely a candidate for taking a long position. There's ambiguity as to the Elliott wave count at the February peaks. Its possible the second high made on February 19th could be a truncated 5th wave - where wave five fails to exceed the termination point of wave three. This ambiguity is not a factor in analyzing the noticeably clear five - wave pattern off the March 18th bottom. Note it's possible to see the smaller degree five - wave pattern within the supposed wave "5" After TSLA's April 30th top it came straight down to chart support and near a .382 retrace of its rally from mid - March. Its possible wave "A" of the corrective process could be complete or close to completion. If the corrective process continues, the next most likely support zone is a .618 retrace near 550. A great setup to initiate long positions could be at hand if the daily Stochastic reaches the oversold zone, with TSLA near 550, and after a three-wave decline. |
|
| Figure 3. TSLA is clearly outperforming the broader market and definitely a candidate for taking a long position. |
| Graphic provided by: tradingview.com. |
| |
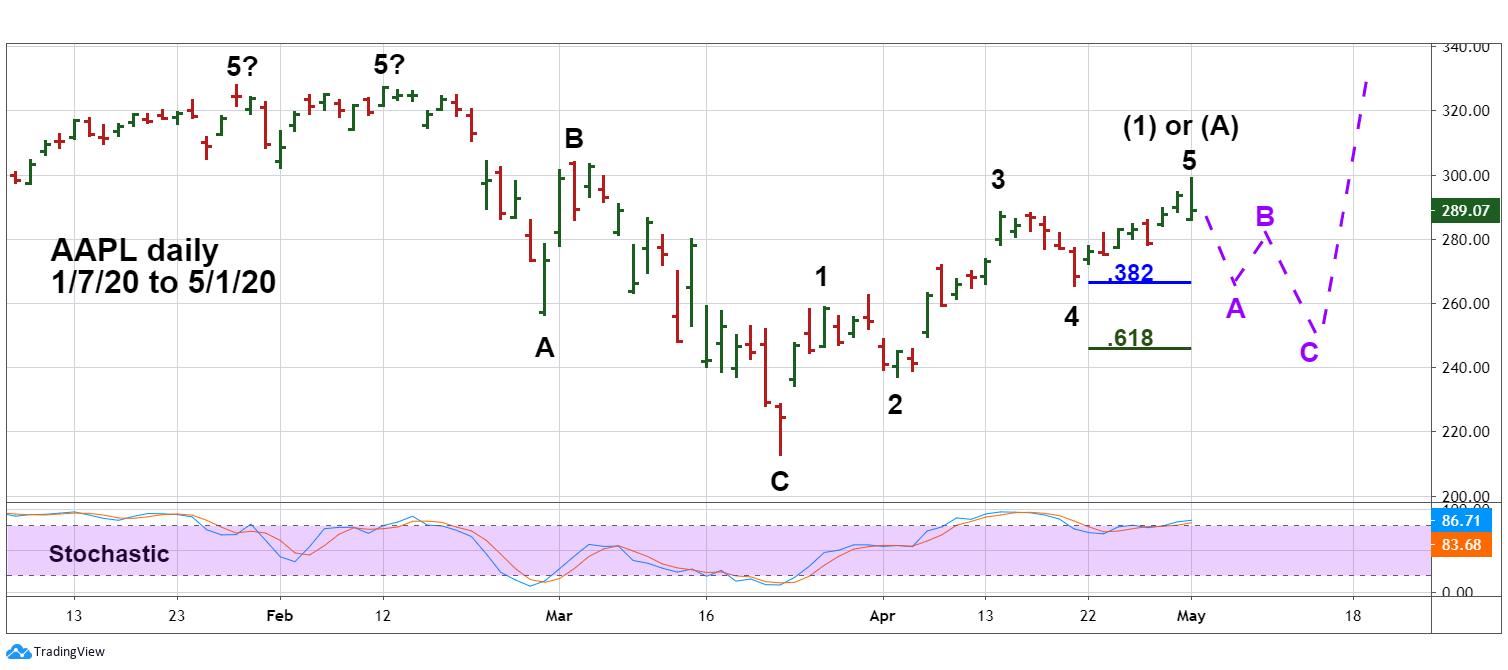
| Apple Inc. Please see the daily Apple Inc. (AAPL) chart illustrated in Figure 4. As of May 1, AAPL, assuming it reached a near term peak, has held up stronger than the SPX and TSLA. If it's in a decline the retracement could be shallower than TSLA or SPX. Again, daily Stochastic could be an excellent tool to help identify a potential bottom. No pattern is 100% effective. If the SPX, TSLA and AAPL fail to exceed their respective 2020 highs and break below their crash bottoms it would imply a larger bear market could be developing. |
|
| Figure 4. As of May 1, AAPL, assuming its reached a near term peak, has held up stronger than the SPX and TSLA. |
| Graphic provided by: tradingview.com. |
| |
| Time Factor The SPX late April top came right on the cusp of a seasonally bearish time for US stocks. If the decline continues into late May the proportion of the decline could be right in line with what's expected for wave (2). There are limitations to using Elliott wave analysis on individual stocks. There could be a clear pattern over a period of several months while the picture over several years could be ambiguous. Intraday Elliott analysis is most effective on stock indices yet may not be the best tool for stocks. Elliott wave analysis for stocks should be used sparingly and only when there are clear patterns. Both TSLA and AAPL have clear patterns that provide evidence for speculation in those issues and provide additional evidence for timing the broader US stock market. Further Reading: Frost A.J and Robert Prechter (1985) "Elliott Wave Principle", New Classics Library. |
Independent investment advisor, trader and writer. He has written articles for Technical Analysis of Stocks & Commodities, Traders.com Advantage,Futuresmag.com and, Finance Magnates. Author of website Four Dimension Trading.
| Website: | www.fourdimensiontrading.com |
| E-mail address: | markrivest@gmail.com |
Click here for more information about our publications!
Comments
Date:�06/02/20Rank:�5Comment:�

Request Information From Our Sponsors
- StockCharts.com, Inc.
- Candle Patterns
- Candlestick Charting Explained
- Intermarket Technical Analysis
- John Murphy on Chart Analysis
- John Murphy's Chart Pattern Recognition
- John Murphy's Market Message
- MurphyExplainsMarketAnalysis-Intermarket Analysis
- MurphyExplainsMarketAnalysis-Visual Analysis
- StockCharts.com
- Technical Analysis of the Financial Markets
- The Visual Investor
- VectorVest, Inc.
- Executive Premier Workshop
- One-Day Options Course
- OptionsPro
- Retirement Income Workshop
- Sure-Fire Trading Systems (VectorVest, Inc.)
- Trading as a Business Workshop
- VectorVest 7 EOD
- VectorVest 7 RealTime/IntraDay
- VectorVest AutoTester
- VectorVest Educational Services
- VectorVest OnLine
- VectorVest Options Analyzer
- VectorVest ProGraphics v6.0
- VectorVest ProTrader 7
- VectorVest RealTime Derby Tool
- VectorVest Simulator
- VectorVest Variator
- VectorVest Watchdog