

HOT TOPICS LIST
- MACD
- Fibonacci
- RSI
- Gann
- ADXR
- Stochastics
- Volume
- Triangles
- Futures
- Cycles
- Volatility
- ZIGZAG
- MESA
- Retracement
- Aroon
INDICATORS LIST
LIST OF TOPICS
PRINT THIS ARTICLE
by Mark Rivest
What stocks could have the most upside potential?
Position: Buy
Mark Rivest
Independent investment advisor, trader and writer. He has written articles for Technical Analysis of Stocks & Commodities, Traders.com Advantage,Futuresmag.com and, Finance Magnates. Author of website Four Dimension Trading.
PRINT THIS ARTICLE
MOMENTUM
Follow The Leader
04/30/20 05:33:03 PMby Mark Rivest
What stocks could have the most upside potential?
Position: Buy
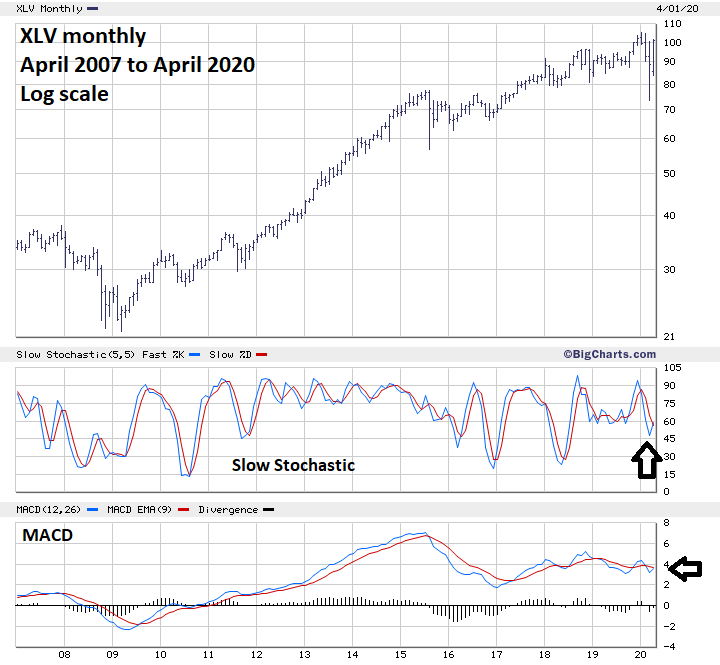
| In the early 1960's Nicholas Darvas wrote "How I Made $2,000,000 In The Stock Market". The book introduced the public to a secret known for decades by some professional traders, buy high and sell higher. The average investor/trader want to buy stocks at a significant discount from where they have recently traded. Darvas illustrated that the highest probability of profiting from a stock trade was to buy a stock at or near its 52-week high. This concept is still true and an examination of stock market sectors reveals where you could maximize profits in the crash rebound. Health Care Sector Just after a sharp and deep market decline there could be very few stocks at or near their 52-week highs. The general concept is to buy stocks that are outperforming the market. In the current post crash environment look for sectors and stocks that have retraced the greatest percentage of the crash. SPDR funds have divided the S&P 500 (SPX) stocks into eleven Exchange Traded Funds (ETF) called sector funds. Comparing the SPX's 2020 performance against the eleven sector funds revels which sector has strongest post-crash rally. Please see the monthly Health Care sector fund (XLV) chart illustrated in Figure 1. In the wake of the Coronavirus crisis its not surprising Health care is the leading sector. As of April 17, 2020, the SPX had retraced 57% of the decline from its all-time high. XLV had retraced 87% of its decline, the strongest of all eleven sectors. Note that the monthly Slow Stochastic had a bullish cross-over which implies XLV could continue to rise for several months. The monthly MACD lines are close to a bullish cross-over. If they do cross it increases the probability of a multi month XLV rise. |
|
| Figure 1. XLV has retraced 87% of its decline, the strongest of all eleven sectors. |
| Graphic provided by: BigCharts.com. |
| |
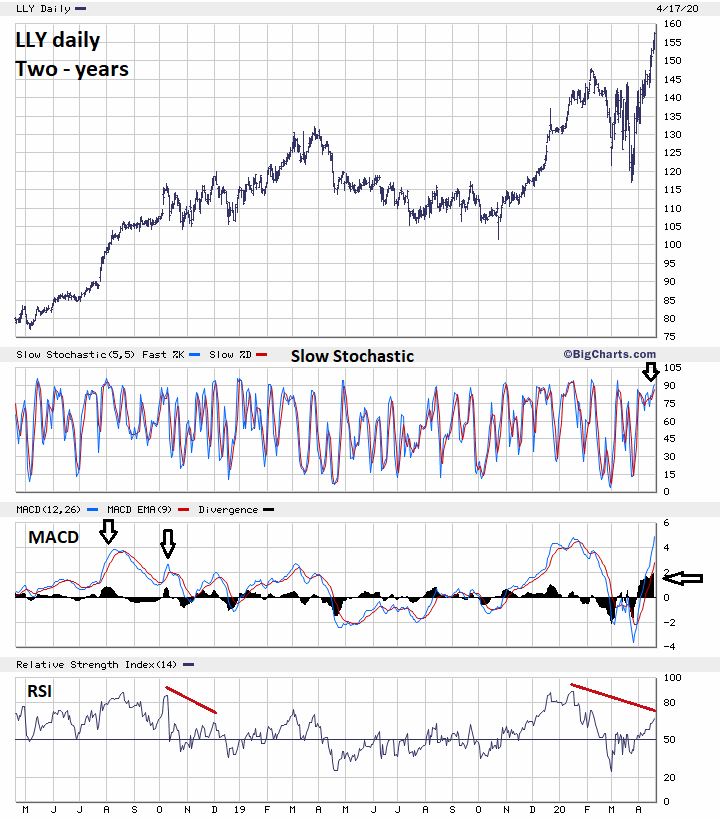
| Eli Lilly And Company After finding the strongest sector the next step is to find which stocks within the sector are the strongest. Please see the daily Eli Lilly and Company (LLY) chart illustrated in Figure 2. LLY is one of the very few stocks that is trading above its February 2020 high, this company is clearly in an elite group — the strongest of the strong. Momentum indicators have a mixed message, note the daily RSI has a significant bearish divergence vs the stocks January and February peaks. However, the daily MACD Histogram has reached an extremely high level — this is almost always a very bullish signal, note the July to August 2018 rally. The MACD Histogram usually has several divergences before a stock or market turns; the current high reading implies there could be several weeks of rising prices before a significant top could be in place. The daily Slow Stochastic is near 90, indicating LLY is overbought and due for at least a short-term pull back. |
|
| Figure 2. LLY is one of the very few stocks that is trading above its February 2020 high. |
| Graphic provided by: BigCharts.com. |
| |
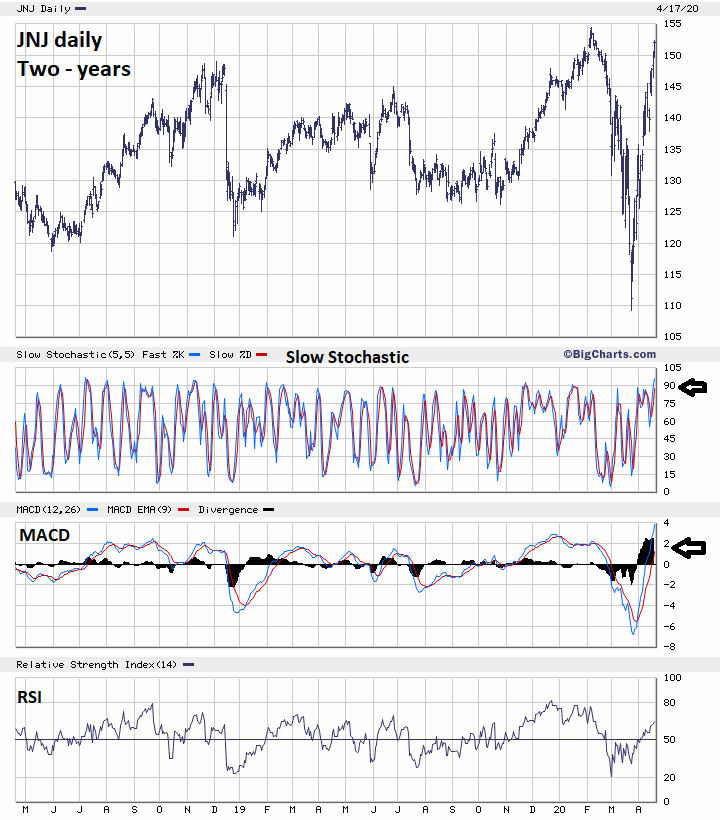
| Johnson and Johnson Please see the daily Johnson and Johnson (JNJ) chart illustrated in Figure 3. JNJ's post-crash retracement is 95% outperforming XLV and is a good candidate for buying. Its daily Slow Stochastic has reached the 90-area, indicating at least a near-term peak could come soon. A possible double top with the January high could be forming. Double tops are potentially bearish, however if the subsequent decline is choppy and shallow it could be just a pause in an ongoing bull move. If JNJ does make a double top it could be the first part of a bullish Cup and Handle formation. More information about the Cup and Handle pattern can be found in William O'Neil's book, "How To Make Money In Stocks". |
|
| Figure 3. JNJ�s post-crash retracement is 95% outperforming XLV and is a good candidate for buying. |
| Graphic provided by: BigCharts.com. |
| |
| Strategy For Any Market Environment Successful trading/investing requires making choices based upon the probabilities. You need to have as much evidence as possible before buying or selling. Buying stocks that are stronger than a rising market and shorting weaker relative stocks in a falling market is a proven strategy with decades of history. Further Reading: Darvas Nicolas (1971) "How I Made $2,000,000 in the Stock Market" Lyle Stuart Inc. O'Neil J. William (2009) "How to Make Money in Stocks", McGraw-Hill Mark Rivest |
Independent investment advisor, trader and writer. He has written articles for Technical Analysis of Stocks & Commodities, Traders.com Advantage,Futuresmag.com and, Finance Magnates. Author of website Four Dimension Trading.
| Website: | www.fourdimensiontrading.com |
| E-mail address: | markrivest@gmail.com |
Click here for more information about our publications!
PRINT THIS ARTICLE

Request Information From Our Sponsors
- StockCharts.com, Inc.
- Candle Patterns
- Candlestick Charting Explained
- Intermarket Technical Analysis
- John Murphy on Chart Analysis
- John Murphy's Chart Pattern Recognition
- John Murphy's Market Message
- MurphyExplainsMarketAnalysis-Intermarket Analysis
- MurphyExplainsMarketAnalysis-Visual Analysis
- StockCharts.com
- Technical Analysis of the Financial Markets
- The Visual Investor
- VectorVest, Inc.
- Executive Premier Workshop
- One-Day Options Course
- OptionsPro
- Retirement Income Workshop
- Sure-Fire Trading Systems (VectorVest, Inc.)
- Trading as a Business Workshop
- VectorVest 7 EOD
- VectorVest 7 RealTime/IntraDay
- VectorVest AutoTester
- VectorVest Educational Services
- VectorVest OnLine
- VectorVest Options Analyzer
- VectorVest ProGraphics v6.0
- VectorVest ProTrader 7
- VectorVest RealTime Derby Tool
- VectorVest Simulator
- VectorVest Variator
- VectorVest Watchdog