HOT TOPICS LIST
- MACD
- Fibonacci
- RSI
- Gann
- ADXR
- Stochastics
- Volume
- Triangles
- Futures
- Cycles
- Volatility
- ZIGZAG
- MESA
- Retracement
- Aroon
INDICATORS LIST
LIST OF TOPICS
PRINT THIS ARTICLE
by Mark Rivest
Using momentum and time factors to interpret Elliott Wave patterns.
Position: N/A
Mark Rivest
Independent investment advisor, trader and writer. He has written articles for Technical Analysis of Stocks & Commodities, Traders.com Advantage,Futuresmag.com and, Finance Magnates. Author of website Four Dimension Trading.
PRINT THIS ARTICLE
ELLIOTT WAVE
Elliott Wave Crossroads
05/20/20 12:34:18 PMby Mark Rivest
Using momentum and time factors to interpret Elliott Wave patterns.
Position: N/A
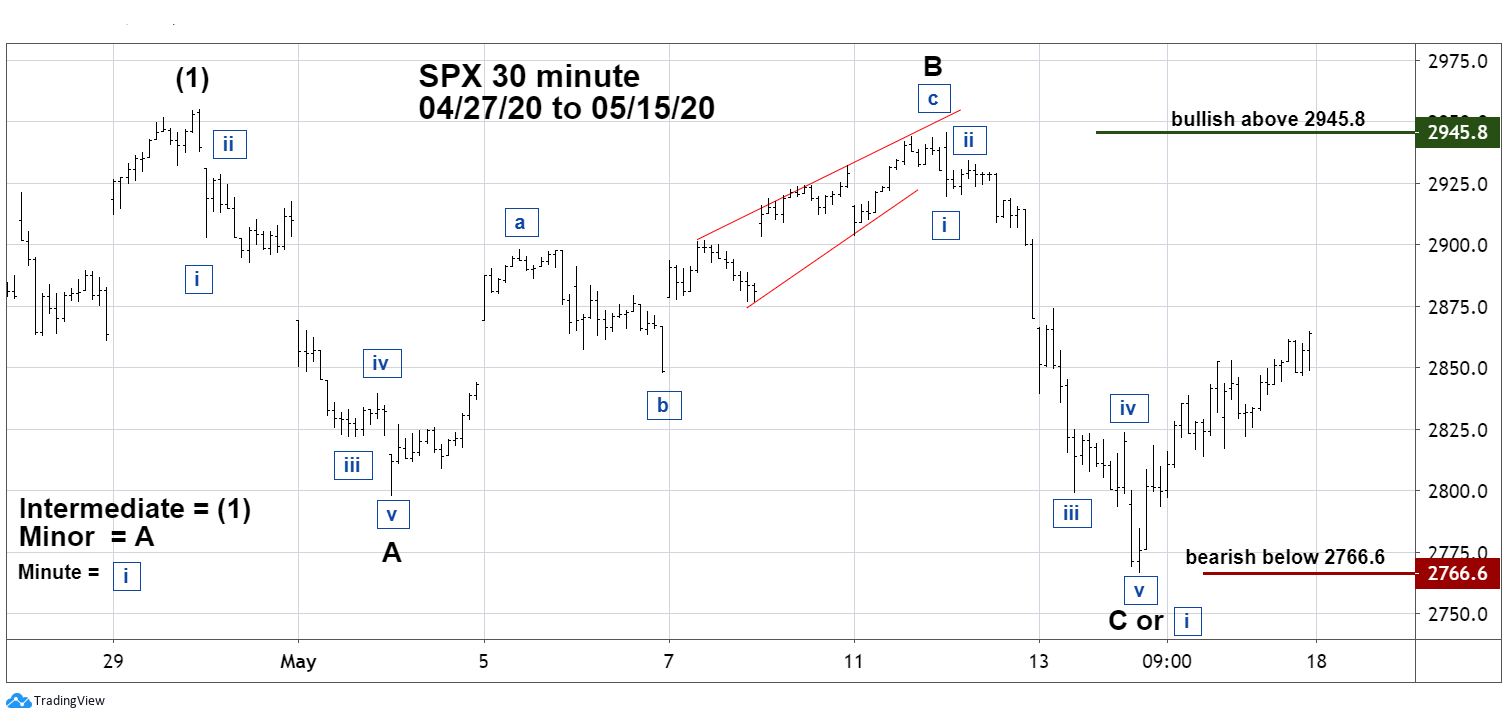
| Elliott Wave theory can, at times, give amazing glimpses into the future, providing a roadmap of where markets could be headed. It can also be a subjective tool; with thirteen different patterns there could be several interpretations for market directions. Expanding your horizon into the dimensions of momentum and time could increase the chances of determining a market's path. S&P 500 Intraday Pattern Elliott Waves are cumulative. When charting any entity, the pattern on a one-minute chart is part of a larger structure on an hourly chart. Hourly patterns are part of a daily chart which are part of a weekly pattern that continues growing to infinity. My May 11 article "How to use Elliott Wave Theory With Individual Stocks" noted that the S&P 500 (SPX) may have reached a short-term peak on April 29. Please see the 30-minute SPX chart illustrated in Figure 1. The subsequent action has taken the form of clear Elliott pattern of five waves down followed by three waves up concluding with five waves down — referred to as a Single Zigzag. Clarity on each of the five waves down can be seen even on a five-minute chart. The second part of Minor wave "B" appears to be an Ending Diagonal Triangle (EDT). This is a rare example in which the fourth wave of the EDT does not overlap into the territory of the first wave; an acceptable alternate count is a Triple Zigzag formation. Based solely on pattern it would appear the decline is complete. From an Elliott Wave perspective, a subsequent move above the supposed Minor wave "B" is bullish. From a trader's view, just above SPX 2945.8 is the spot to place stop buy orders. A subsequent decline below 2766.6 implies more downside action. As of May 15, should a trader buy into the rally or short into the rise? The answer could be found by studying momentum and time factors. |

|
| Figure 1. Based solely on pattern it would appear the decline is complete. |
| Graphic provided by: tradingview.com. |
| |
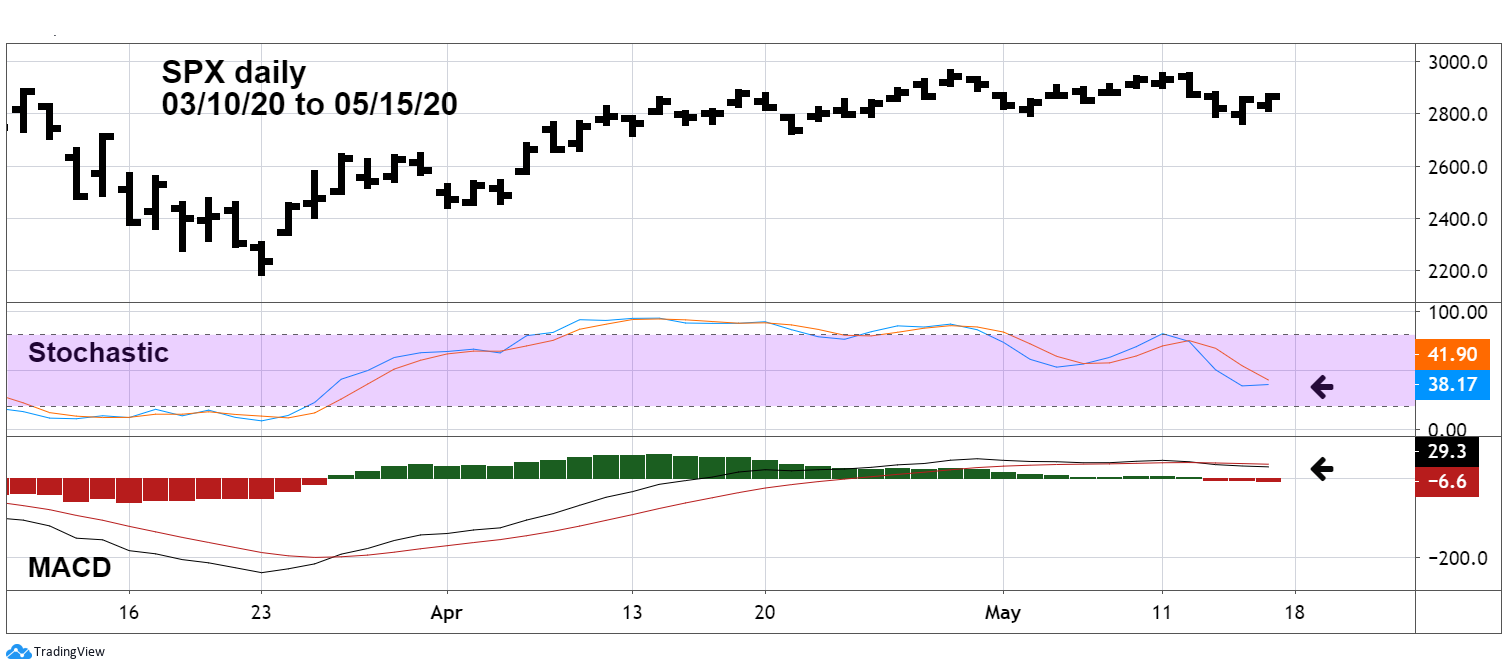
| S&P 500 Daily US stock market rallies can sometimes peak in late April to early May. Classic examples can be seen on SPX charts during 2010, 2011 and 2019. Please see the daily SPX chart illustrated in Figure 2. Right on cue the SPX post-crash rally peaked April 29. Usually the seasonal decline continues throughout May and possibly into June. As of mid-May, there's still time for decline. Additionally, momentum indicators as of May 15 had still not reached oversold zones. Daily SPX Stochastic is still in the neutral zone and the daily MACD lines have not broken below the zero line. There is, of course, no guarantee these indicators have to achieve oversold levels; the SPX could continue its rally off the May 14 bottom. From a trader's perspective it's better to wait for additional evidence before entering long positions. If daily Stochastic and MACD can reach oversold levels in late May or June it could increase the probabilities for trading the long side. |

|
| Figure 2. US stock market rallies can sometimes peak in late April to early May. |
| Graphic provided by: tradingview.com. |
| |
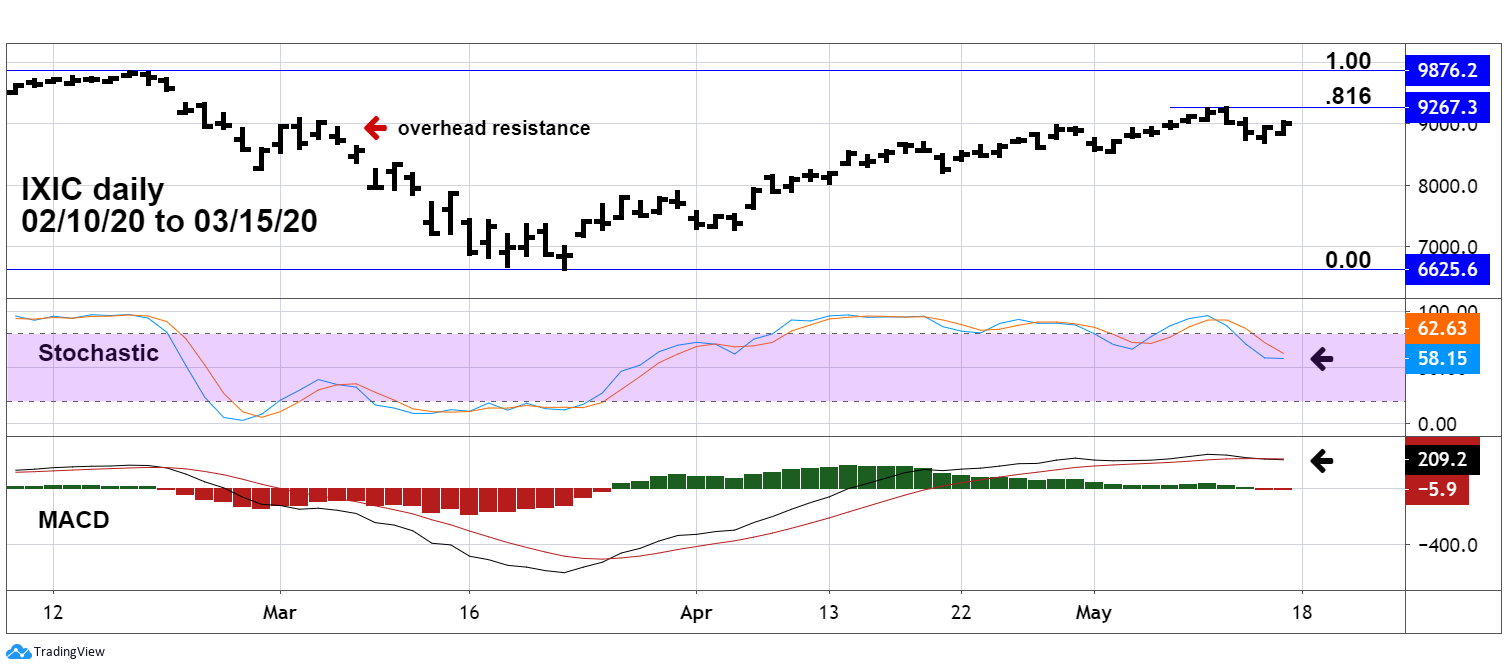
| Nasdaq Composite Daily Evidence that the post-crash rally could continue for several months comes from the Nasdaq Composite. Please see the daily Nasdaq Composite (IXIC) chart illustrated in Figure 3. While the SPX and other US stock indices made rally peaks on April 29, IXIC continued to rise, topping on May 12. Additionally, the post-crash rally has moved decisively above a Fibonacci .618 retracement of the crash and broke above overhead resistance. These breakthroughs open a door to the next resistance level — the IXIC all-time high made in February. Even during a seasonally bearish period some US stocks have continued to climb, implying that the primary trend is up. Shorter term, the IXIC intraday decline from May 12 took the form of a clear five-waves down, implying the subsequent rally could fail, opening the door for a move below the IXIC May 14 bottom. |

|
| Figure 3. While the SPX and other US stock indices made rally peaks on April 29, IXIC continued to rise. |
| Graphic provided by: tradingview.com. |
| |
| Comprehensive Approach Price patterns are subject to interpretation. You need evidence from the dimensions of momentum, time, and sentiment to support the interpretation. In mid-May 2020, the time dimension is the most important, implying US stocks are vulnerable for decline. Focus on the daily momentum indicators; if they reach oversold levels in late May to June 2020 an intermediate bottom could be forming. If the SPX does not drop below 2766.6 and rallies above 2945.8 it implies a correction bottom is in place and the post-crash rally could continue for several months. Good detectives gather as much evidence as possible. Expand your horizon beyond the dimension of price and look at the weight of evidence from all four market dimensions before placing a trade. Further Reading: Frost A.J and Robert Prechter (1985) "Elliott Wave Principle", New Classics Library. |
Independent investment advisor, trader and writer. He has written articles for Technical Analysis of Stocks & Commodities, Traders.com Advantage,Futuresmag.com and, Finance Magnates. Author of website Four Dimension Trading.
| Website: | www.fourdimensiontrading.com |
| E-mail address: | markrivest@gmail.com |
Click here for more information about our publications!
Comments
Date: 06/02/20Rank: 5Comment:

Request Information From Our Sponsors
- StockCharts.com, Inc.
- Candle Patterns
- Candlestick Charting Explained
- Intermarket Technical Analysis
- John Murphy on Chart Analysis
- John Murphy's Chart Pattern Recognition
- John Murphy's Market Message
- MurphyExplainsMarketAnalysis-Intermarket Analysis
- MurphyExplainsMarketAnalysis-Visual Analysis
- StockCharts.com
- Technical Analysis of the Financial Markets
- The Visual Investor
- VectorVest, Inc.
- Executive Premier Workshop
- One-Day Options Course
- OptionsPro
- Retirement Income Workshop
- Sure-Fire Trading Systems (VectorVest, Inc.)
- Trading as a Business Workshop
- VectorVest 7 EOD
- VectorVest 7 RealTime/IntraDay
- VectorVest AutoTester
- VectorVest Educational Services
- VectorVest OnLine
- VectorVest Options Analyzer
- VectorVest ProGraphics v6.0
- VectorVest ProTrader 7
- VectorVest RealTime Derby Tool
- VectorVest Simulator
- VectorVest Variator
- VectorVest Watchdog
