

HOT TOPICS LIST
- MACD
- Fibonacci
- RSI
- Gann
- ADXR
- Stochastics
- Volume
- Triangles
- Futures
- Cycles
- Volatility
- ZIGZAG
- MESA
- Retracement
- Aroon
INDICATORS LIST
LIST OF TOPICS
PRINT THIS ARTICLE
by Mark Rivest
See why the 2020 crash could be the shortest bear market in US history.
Position: N/A
Mark Rivest
Independent investment advisor, trader and writer. He has written articles for Technical Analysis of Stocks & Commodities, Traders.com Advantage,Futuresmag.com and, Finance Magnates. Author of website Four Dimension Trading.
PRINT THIS ARTICLE
MOMENTUM
The Bull is Dead, Long Live the Bull
04/02/20 03:49:33 PMby Mark Rivest
See why the 2020 crash could be the shortest bear market in US history.
Position: N/A
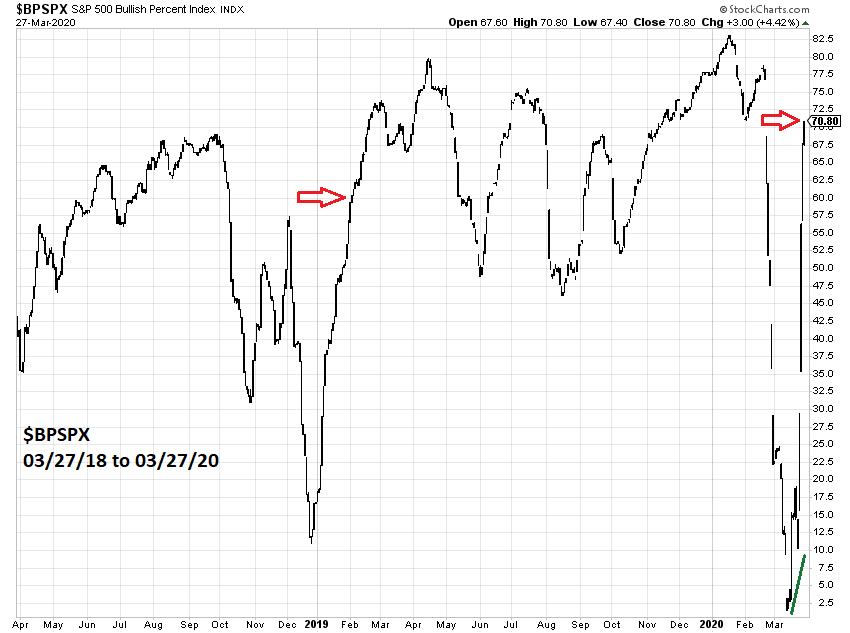
| The Coronavirus has brought havoc to the world economies and markets. The US stock market has fallen with mind boggling speed from its all-time high, and it appears the eleven year bull market is dead. However, evidence has emerged in the week of March 23 to 27 that suggests a new stock bull market may have begun. Bullish Percent Index My March 26, 2020 article "Dawn of the Bear Market?" noted Dow Jones Industrial Average (DJIA) point & figure support in zones with lower boundaries at 17907 and 18086. So far, the DJIA crash low is at 18213, within the upper end of the zone. The S&P 500 (SPX) August to October 1987 bear market, the shortest in US history, registered a 35.9% decline from its all-time high. The February to March 2020 decline is so far 35.4% — an example of the Fibonacci ratio of 1/1 or equality. Please see the SPX Bullish Percent Index chart illustrated in Figure 1. Stockcharts.com symbol for the Bullish Percent Index is $BPSPX, and it measures the percentage of stocks within the SPX that are on Point & Figure buy signals. The move up of this indicator is staggering! Within a week and a half $BPSPX has retraced 85% of its decline from the January 2020 high. Note that after the September to December 2018 decline it took until February 4, 2019, more than a month, to retrace 85%. On that date the SPX had retraced about 60% of its September to December drop and ultimately went on to make new all-time highs. Also note that on March 23, the SPX price low, $BPSPX registered a bullish divergence. The Bullish Percent Index reading for the Nasdaq 100 is even more incredible. $BPNDX has, as of March 27, retraced 99% of its January to March decline. Beneath the surface a very powerful and widespread upward movement in US stocks may have begun. |
|
| Figure 1. The move up of this indicator is staggering! Within a week and a half $BPSPX has retraced 85% of its decline from the January 2020 high. |
| Graphic provided by: StockCharts.com. |
| |
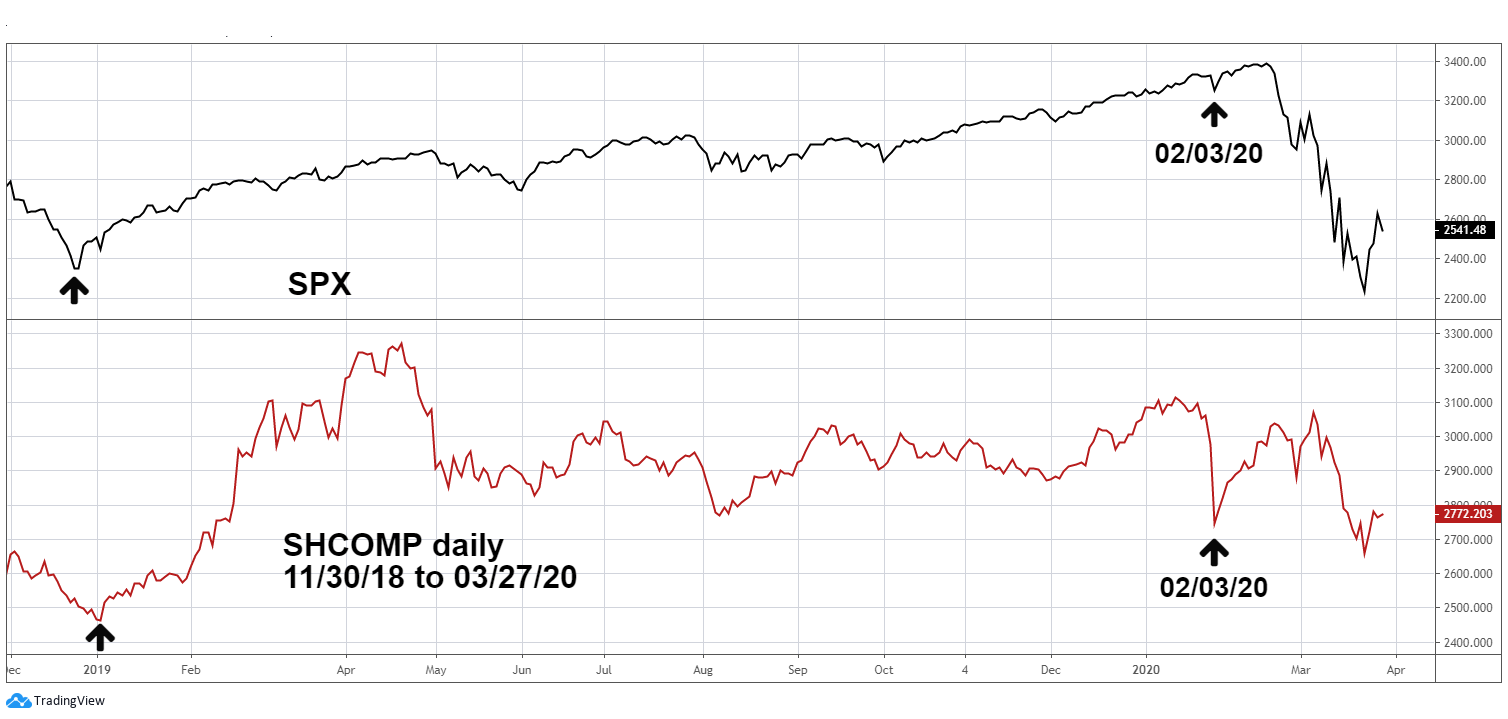
| Shanghai Composite For several years China's Shanghai Composite (SHCOMP) has been underperforming the SPX. This indicates the Chinese economy was relatively weaker than the US economy. Before the virus crisis the SPX was the strongest of the major national stock indices, SHCOMP was the weakest. Now it's changed. Please see the daily SHCOMP and SPX chart illustrated in Figure 2. From its February peak to March 23 the SPX has fallen 35% while SHCOMP, as of March 23, has dropped only 15% from its January top. As of the close on March 27 the SPX was down 25% from its 2020 high, while SHCOMP was down only 11%. Measured from the bottoms made on February 3 to March 27, the SPX was down 21% an dSHCOMP was up 1%. The virus crisis began in China, which until recently had the most exposure and deaths. You would expect because of its relatively weaker economy SHCOMP should be experiencing a super crash. SHCOMP has been relatively stronger than the SPX and its powerful evidence a new bull market may have begun. Hopefully the worst of the virus crisis in China is over. |
|
| Figure 2. SHCOMP has been relatively stronger than the SPX and it's powerful evidence a new bull market may have begun. |
| Graphic provided by: tradingview.com. |
| |
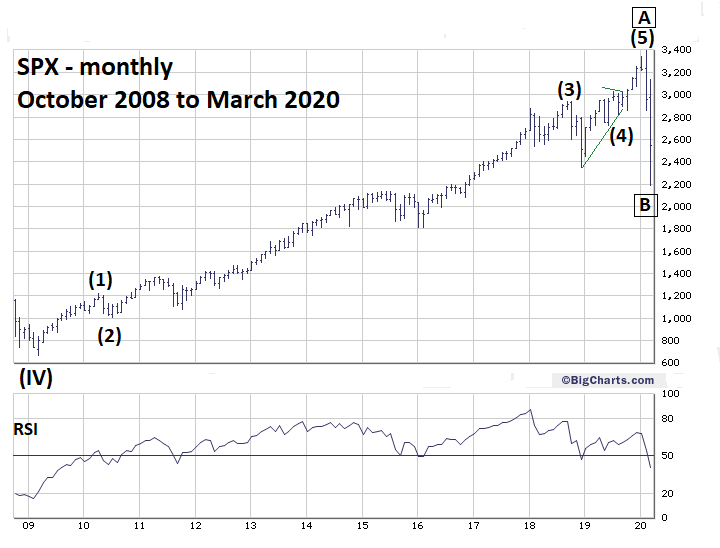
| Elliott Wave Count From March 2009 Please see the SPX monthly chart illustrated in Figure 3. The rally from March 2009 to the all-time high in February 2020 counts as a completed Elliott five-wave pattern. After completion of five waves there's normally a retracement in both price and time relative to completed pattern. The 2020 crash has retraced about 44% of the 2009 to 2020 bull market — this is a price percentage size you could expect. The time percentage is unusual. After a nearly eleven-year advance you would expect the subsequent correction to last several years. The decline so far has been just more than one month. There's precedence for very short-time corrections. The 1982 to 1987 five-wave bull market was corrected in only about two months with the August to October crash. Subsequently, the main US stock indices moved to new all-time highs that continued until 1990. If the 2020 bear market is complete, does it mean the SPX could rally for another three years? The 1987 crash came after only a five-year economic expansion. The February 2020 top came after a nearly eleven-year expansion, so if there's another bull run it may not last three years. |
|
| Figure 3. The 2020 crash has retraced about 44% of the 2009 to 2020 bull market. |
| Graphic provided by: BigCharts.com. |
| |
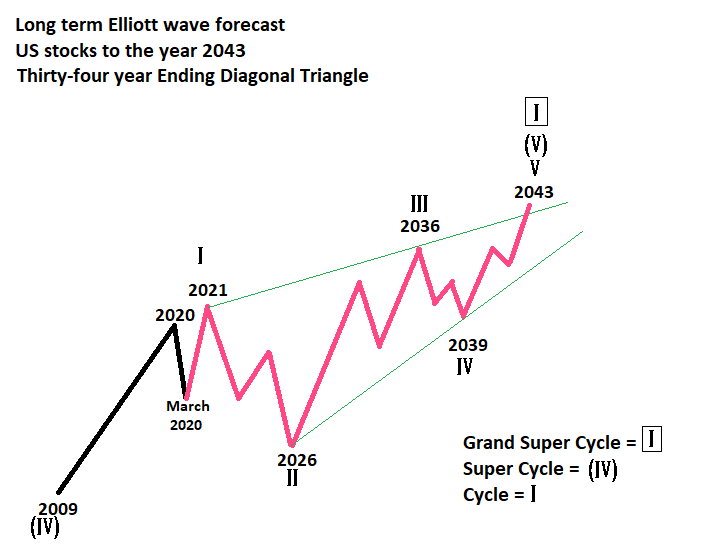
| Long-term Forecast Elliott wave Ending Diagonal Triangles are termination patterns that occur in the fifth wave positions of motive waves, and in wave "C" of corrective waves. They are the only motive waves in which all five sub waves are composed of three waves or a combination of three waves. The SPX December 2018 bottom appeared to be the fourth wave a motive pattern that began in March 2009. My December 5, 2019 article "Setting Trading Targets - Part Two" noted that because of the choppy nature of the rally from late 2018 an Ending Diagonal Triangle could be forming. My article "The US Long Wave" in the 2015 bonus issue of Technical Analysis of Stocks and Commodities speculated that the March 2009 US stock market bottom could be the fourth wave a multi-century bull market that began in the year 1790. Subsequently to 2009 there could be a multi-decade bull market fifth wave up. Please see the long-term Elliott wave forecast chart in Figure 4. The February 2020 SPX peak could be: 1) Completed Cycle wave "I" 2) Primary wave "A" boxed of Cycle wave "I" 3) Completed Super Cycle wave (V) My reasons for suspecting Super Cycle wave (V) could end sometime in the mid-twenty first century are explained in "The US Long Wave". Based on powerful evidence from SHCOMP and $BPSPX the SPX, February 2020 has a high probability of being the end point of Primary wave "A" of cycle wave "I". |
|
| Figure 4. The March 2009 US stock market bottom could be the fourth wave a multi-century bull market that began in the year 1790. |
| Graphic provided by: Mark Rivest. |
| |
| Short-term Forecast My January 9, 2020 article "Forecast For US Stocks In 2020" noted there could be a significant stock market turn in 2021. The subsequent crash would appear to increase the chance the significant turn could be a bottom. The near-term bullish evidence argues against this scenario, and US stocks could make new all-time highs sometime in 2021. There's also one very strong piece of fundamental evidence. The US-FOMC is aggressively increasing liquidity. Tightening liquidity is bearish for stocks, easing liquidity is bullish. Remember the old Wall Street axiom — "Don't fight the Fed". Further Reading: Neill B. Humphrey (1985) "The Art of Contrary Thinking" The Caxton Printers. Frost A.J and Robert Prechter (1985) "Elliott Wave Principle", New Classics Library. |
Independent investment advisor, trader and writer. He has written articles for Technical Analysis of Stocks & Commodities, Traders.com Advantage,Futuresmag.com and, Finance Magnates. Author of website Four Dimension Trading.
| Website: | www.fourdimensiontrading.com |
| E-mail address: | markrivest@gmail.com |
Click here for more information about our publications!
PRINT THIS ARTICLE

Request Information From Our Sponsors
- StockCharts.com, Inc.
- Candle Patterns
- Candlestick Charting Explained
- Intermarket Technical Analysis
- John Murphy on Chart Analysis
- John Murphy's Chart Pattern Recognition
- John Murphy's Market Message
- MurphyExplainsMarketAnalysis-Intermarket Analysis
- MurphyExplainsMarketAnalysis-Visual Analysis
- StockCharts.com
- Technical Analysis of the Financial Markets
- The Visual Investor
- VectorVest, Inc.
- Executive Premier Workshop
- One-Day Options Course
- OptionsPro
- Retirement Income Workshop
- Sure-Fire Trading Systems (VectorVest, Inc.)
- Trading as a Business Workshop
- VectorVest 7 EOD
- VectorVest 7 RealTime/IntraDay
- VectorVest AutoTester
- VectorVest Educational Services
- VectorVest OnLine
- VectorVest Options Analyzer
- VectorVest ProGraphics v6.0
- VectorVest ProTrader 7
- VectorVest RealTime Derby Tool
- VectorVest Simulator
- VectorVest Variator
- VectorVest Watchdog