HOT TOPICS LIST
- MACD
- Fibonacci
- RSI
- Gann
- ADXR
- Stochastics
- Volume
- Triangles
- Futures
- Cycles
- Volatility
- ZIGZAG
- MESA
- Retracement
- Aroon
INDICATORS LIST
LIST OF TOPICS
PRINT THIS ARTICLE
by Mark Rivest
Deep retracements of stock indices could be the start of a larger decline.
Position: N/A
Mark Rivest
Independent investment advisor, trader and writer. He has written articles for Technical Analysis of Stocks & Commodities, Traders.com Advantage,Futuresmag.com and, Finance Magnates. Author of website Four Dimension Trading.
PRINT THIS ARTICLE
FIBONACCI
Dawn of the Bear Market?
03/26/20 05:09:34 PMby Mark Rivest
Deep retracements of stock indices could be the start of a larger decline.
Position: N/A
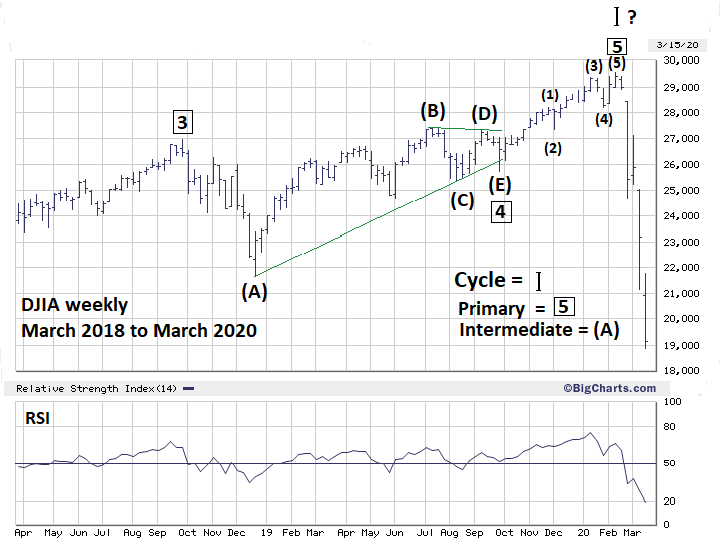
| For nearly eleven years declines of the three main US stock indices never exceeded 23%. The crash that began February 2020 has pushed the indexes beyond 30% drops. Both the Dow Jones Industrial Average (DJIA) and S&P 500 (SPX) have for the first time since March 2009 broken below prior correction bottoms. Both of these extraordinary events indicate something has changed in the US stock market. There's a high probability we are witnessing the beginning phase of a bear market. Dow Jones Industrial Average - Weekly My December 5, 2019 article "Setting Trading Targets - Part Two" speculated that the choppy rally from the December 2018 bottom could be an Elliott wave Ending Diagonal Triangle. Another choppy, overlapping pattern is an Elliott wave Horizontal Triangle. Please see the weekly DJIA chart illustrated in Figure 1. It now appears the choppiness resulted in a Horizontal Triangle. This structure only appears in the fourth wave position of motive waves. Horizontal Triangles are sideways corrections composed of five sub waves, each of which are composed of three waves or a combination of three waves. The type of Horizontal Triangle illustrated is a Running Triangle in which part, or parts, of the structure exceed the termination point of the third wave. In this Horizontal Triangle both Intermediate waves (B) and (D) exceeded the termination point of Primary wave "3" boxed. Subsequently, after the termination of the Horizontal Triangle at the Intermediate wave (E) bottom, the DJIA rallied in a clear Elliott five-wave impulse pattern. This fifth wave up represents what is very likely the final Primary wave of the bullish pattern that began in March 2009. |

|
| Figure 1. Horizontal Triangles are sideways corrections composed of five sub waves. |
| Graphic provided by: BigCharts.com. |
| |
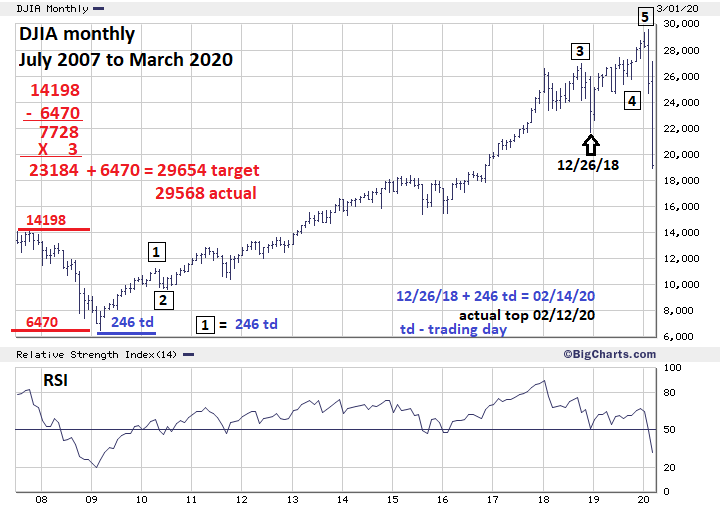
| Fibonacci Price And Time Targets Most of the time markets will turn at Fibonacci retracement or extension points, the degree of the potential turn depends on the size of the structure being measured. My June 8, 2015 article "The Golden Section" noted the SPX had strong Fibonacci resistance at 2138 which was a 1.618 extension of the 2007 to 2009 bear market. The SPX peak at 2134 held for more than a year. In my February 1, 2018 article "How High is Up? Speculated that a 2.618 extension of the 2007 to 2009 bear market at SPX 3047 could be a resistance point. In June 2019 in anticipation that 3047 could be exceed "My article "Setting Trading Targets illustrated there were several Fibonacci points in the SPX low 3300 area that could form an important peak. Please see the monthly DJIA chart illustrated in Figure 2. The DJIA came amazingly close to a 3.00 extension of its 2007 to 2009 bear market. The SPX came even closer to hitting this Fibonacci extension point which was at 3394.70, the actual SPX all-time high was 3393.50! My January 9, 2020 article "Forecast For US Stocks In 2020" discussed Fibonacci time cycles and mentioned this potential turn date. "The supposed Primary wave 4 boxed ended on December 26, 2018. If Primary wave 5 boxed equals Primary wave 1 then February 14, 2020 could be a turn date and probable peak if the DIIA rallies into that date." It now appears the December 26, 2018 bottom was the low of Primary wave 4 boxed. The DJIA all-time high was on February 12, 2020 only two days from a target that was derived from coordinates more than ten years ago. |

|
| Figure 2. The DJIA came amazingly close to a 3.00 extension of its 2007 to 2009 bear market. |
| Graphic provided by: BigCharts.com. |
| |
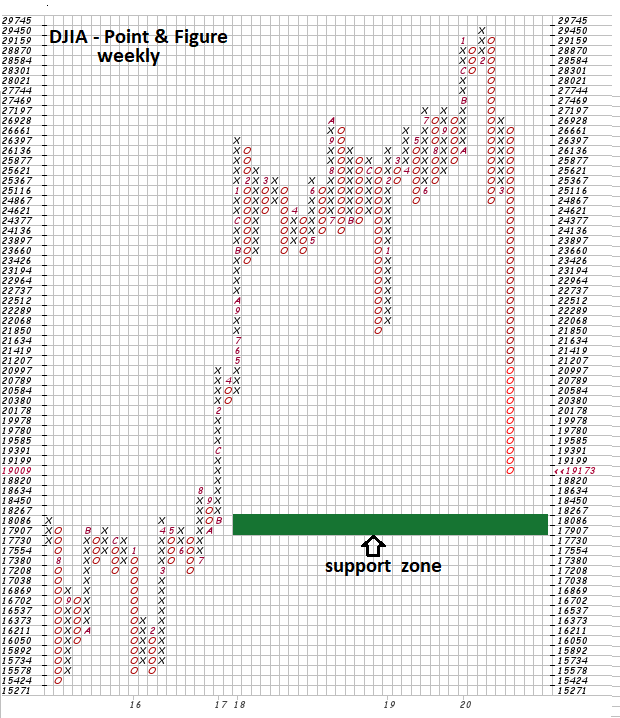
| DJIA - Point & Figure Point & Figure charts are very reliable in discovering potential support/resistance areas. Please see the DJIA weekly Point & Figure chart illustrated in Figure 3. As of the close on March 20 the DJIA intraday Elliott wave count appears incomplete. Additionally, the bottom made on March 19 was not near any significant Fibonacci or chart support areas. The Point & Figure chart shows a cluster zone beginning at 17907 to 18086 — this is in the area of the DJIA 2015 peak which was significant resistance. Additionally, a Fibonacci 50% retrace of the entire 2009 to 2020 bull market is at DJIA 18019. The DJIA 2020 crash could terminate somewhere in the Point & Figure support zone. |

|
| Figure 3. The DJIA 2020 crash could terminate somewhere in the Point & Figure support zone. |
| Graphic provided by: StockCharts.com. |
| |
| Overall View The Coronavirus panic has triggered an unprecedented event in the US stock market, a very deep decline immediately after an all-time high. The DJIA and SPX between mid-February and March 20 declined almost as much as the 1987 August to October crash in less than half the time. At major turns there's an abundance of evidence from all four market dimensions: price, time, sentiment and momentum. The February 2020 top had strong Fibonacci price and time evidence; however, evidence was lacking from the momentum and sentiment dimensions. In particular, my January 30, 2020 article "Elliott Wave Lesson" noted bullish evidence of the NYSE new 52-week highs exceeding the level achieved in 2019. What happened after the all-time highs made in February was a very low probability event. Low probability does not mean no probability. Even in retrospect, the incredibly accurate Fibonacci price and time coordinates can be helpful. These turning points resulting in a sharp decline pushing below the very important December 2018 bottom strongly suggest the dawn of a bear market. US stock bear markets usually last years, if the crash ends sometime in mid to late March the subsequent rally could continue for several weeks or even months. A crash bottom will probably create opportunities on the long side; however, you may need to be nimble trader. In bear markets surprises come on the downside and there could be many surprises in the coming months and years. Further Reading: Frost A.J and Robert Prechter (1985) "Elliott Wave Principle", New Classics Library. Rivest, Mark (2020) "Fibonacci Analysis for Fun and Profit" Technical Analysis of Stocks & Commodities, Volume 38: Bonus Issue. Neill B. Humphrey (1985) "The Art of Contrary Thinking" The Caxton Printers. |
Independent investment advisor, trader and writer. He has written articles for Technical Analysis of Stocks & Commodities, Traders.com Advantage,Futuresmag.com and, Finance Magnates. Author of website Four Dimension Trading.
| Website: | www.fourdimensiontrading.com |
| E-mail address: | markrivest@gmail.com |
Click here for more information about our publications!
Comments
Date: 03/26/20Rank: 5Comment:
Date: 09/11/22Rank: 5Comment:

|

Request Information From Our Sponsors
- StockCharts.com, Inc.
- Candle Patterns
- Candlestick Charting Explained
- Intermarket Technical Analysis
- John Murphy on Chart Analysis
- John Murphy's Chart Pattern Recognition
- John Murphy's Market Message
- MurphyExplainsMarketAnalysis-Intermarket Analysis
- MurphyExplainsMarketAnalysis-Visual Analysis
- StockCharts.com
- Technical Analysis of the Financial Markets
- The Visual Investor
- VectorVest, Inc.
- Executive Premier Workshop
- One-Day Options Course
- OptionsPro
- Retirement Income Workshop
- Sure-Fire Trading Systems (VectorVest, Inc.)
- Trading as a Business Workshop
- VectorVest 7 EOD
- VectorVest 7 RealTime/IntraDay
- VectorVest AutoTester
- VectorVest Educational Services
- VectorVest OnLine
- VectorVest Options Analyzer
- VectorVest ProGraphics v6.0
- VectorVest ProTrader 7
- VectorVest RealTime Derby Tool
- VectorVest Simulator
- VectorVest Variator
- VectorVest Watchdog
