HOT TOPICS LIST
- MACD
- Fibonacci
- RSI
- Gann
- ADXR
- Stochastics
- Volume
- Triangles
- Futures
- Cycles
- Volatility
- ZIGZAG
- MESA
- Retracement
- Aroon
INDICATORS LIST
LIST OF TOPICS
PRINT THIS ARTICLE
by Mark Rivest
What direction could Stocks, Bonds, and Gold take because of the Coronavirus panic?
Position: N/A
Mark Rivest
Independent investment advisor, trader and writer. He has written articles for Technical Analysis of Stocks & Commodities, Traders.com Advantage,Futuresmag.com and, Finance Magnates. Author of website Four Dimension Trading.
PRINT THIS ARTICLE
MARKET TIMING
Virus Panic
03/19/20 12:14:41 PMby Mark Rivest
What direction could Stocks, Bonds, and Gold take because of the Coronavirus panic?
Position: N/A
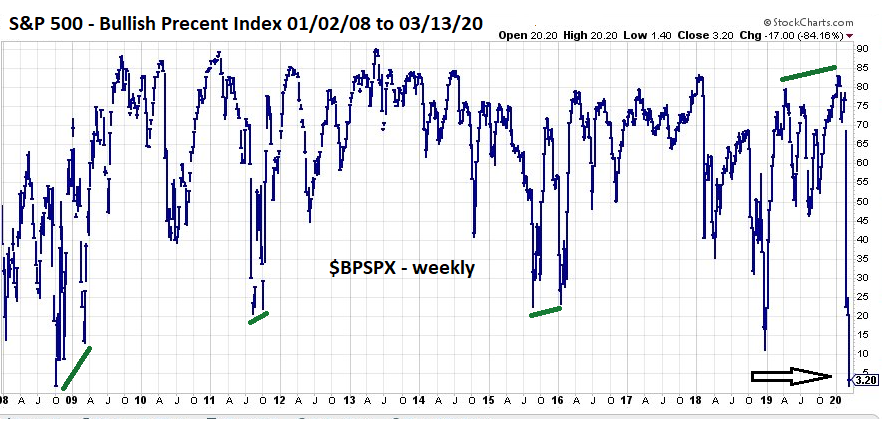
| There's no predestination in any market. All markets reflect the mass human mind, and like an individual mind they can, and will, change direction. The Coronavirus has caused turmoil and triggered turns in many markets worldwide. Signals from US stocks, Treasury bonds, and Gold during the week of March 9-13 could provide directional guidance. Bullish Percent Index One advantage to analyzing stock markets is the ability to discover market strength/weakness by examining components of the market. These are referred to as internal indicators. The Bullish Percent Index measures the percentage of stocks within a particular group that are on Point and Figure buy signals. During bull markets the Bullish Percent Index is not a precise timing indicator, usually requiring a series of bearish divergences over a period of several months before a severe downturn occurs. On rare occasions there can be a precise bullish signal. Please see the weekly Bullish Percent Index illustrated in Figure 1. Stocharts.com symbol for S&P 500 Bullish Percent Index is $BPSPX. The most striking feature on this chart is that $BPSPX has reached the same level as October 2008. The S&P 500 (SPX) declined for over a year before reaching that level in 2008. The current drop has only taken three weeks! Note that in December 2018 $BPSPX gave a rare precise signal for an SPX bottom. The other three buy signals required bullish divergences — the SPX made a lower bottom while $BPSPX made a higher low. Also note $BPSPX in early 2020 exceeded its 2019 high. This supposed bullish signal was discussed in my January 17, 2020 article Stock Market Super Bullish Scenario - Part Two". The Coronavirus panic has completely invalidated this bullish signal. |

|
| Figure 1. The most striking feature on this chart is that $BPSPX has reached the same level as October 2008. |
| Graphic provided by: StockCharts.com. |
| |
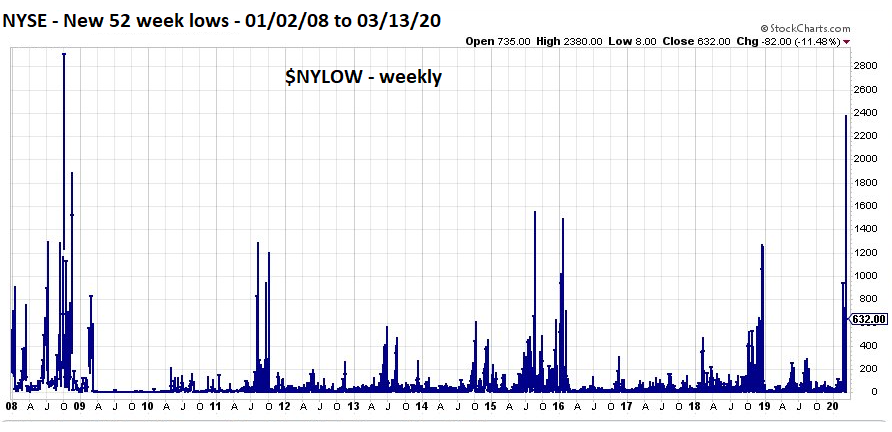
| NYSE New 52-week Lows Another internal momentum indicator is the number of stocks making new 52-week highs/lows within a stock index. Please see the weekly NYSE New 52-week lows chart illustrated in Figure 2. The number of new 52-week lows recorded during the week of March 9-13, 2020 were approximately 2380, as compared to October 2008 when about 2900 new lows were made. Again, the 2020 decline only took three weeks to generate a very high number of new lows vs. one year for the 2008 drop. The new 52-week lows for the Nasdaq Composite are even more stunning. March 2020 has so far had approximately 2100 new 52-week lows vs. 1500 new lows were made in October 2008. |

|
| Figure 2. The number of new 52–week lows recorded during the week of March 9–13, 2020 were approximately 2380, as compared to October 2008 when about 2900 new lows were made. |
| Graphic provided by: StockCharts.com. |
| |
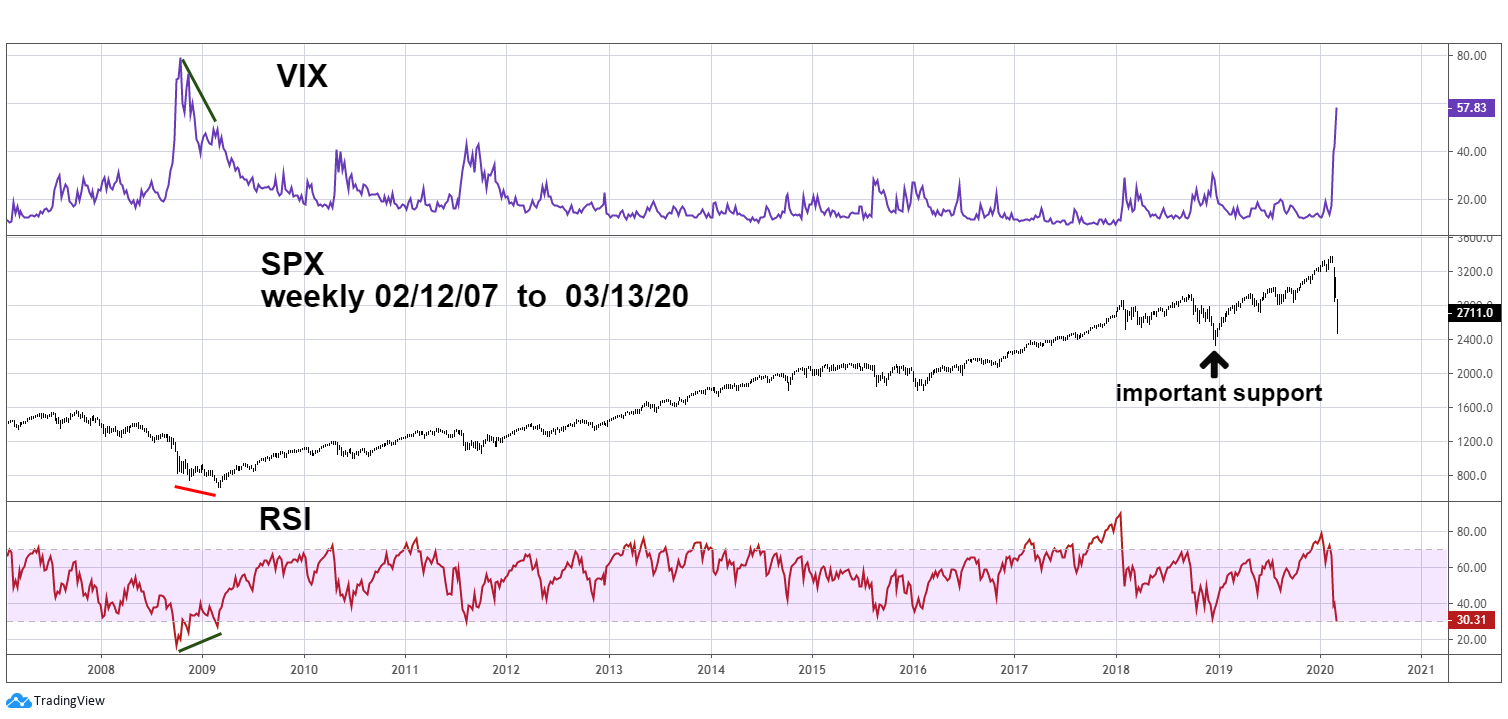
| RSI and VIX Please see the weekly SPX, RSI and VIX chart illustrated in Figure 3. The CBOE Volatility Index, known as VIX, is a great tool to discover bearish sentiment extremes potentially signaling significant stock market bottoms. As of March 13, 2020, the VIX has exceeded all prior spike highs except the peak made in October 2008. In the very short-term prices could go lower. The weekly Relative Strength Indicator know as RSI is a momentum oscillator best used for indicating potential market tops and bottoms. As of March 12, RSI has reached the edge of the oversold zone at 30% and the same level as the December 2018 SPX bottom. However, if this level doesn't hold, an RSI move into the oversold zone could open the door for significantly lower prices. Also note that in 2009 both RSI and VIX had divergences off their extremes recorded in 2008. If there's a repeat of this phenomenon, the SPX could make a lower bottom after March. The SPX bottom at 2346 made in December 2018 represents very important support. My December 5, 2019 article "Setting Trading Targets - Part Two" speculated that because of the choppy rally from the December 2018 bottom, the SPX could be forming an Elliott wave Ending Diagonal Triangle (EDT). In these structures all five component waves subdivide into three wave, or a combination of three wave, patterns. It's possible the entire rally from December 2018 to February 2020 was a Double Zigzag constituting wave one of an EDT. The subsequent February to March drop could be wave two. If the SPX bottom of 2346 is broken it will eliminate this wave count and imply the secular bull market from March 2009 is dead. |

|
| Figure 3. The CBOE Volatility Index known as VIX is a great tool to discover bearish sentiment extremes potentially signaling significant stock market bottoms. |
| Graphic provided by: tradingview.com. |
| |
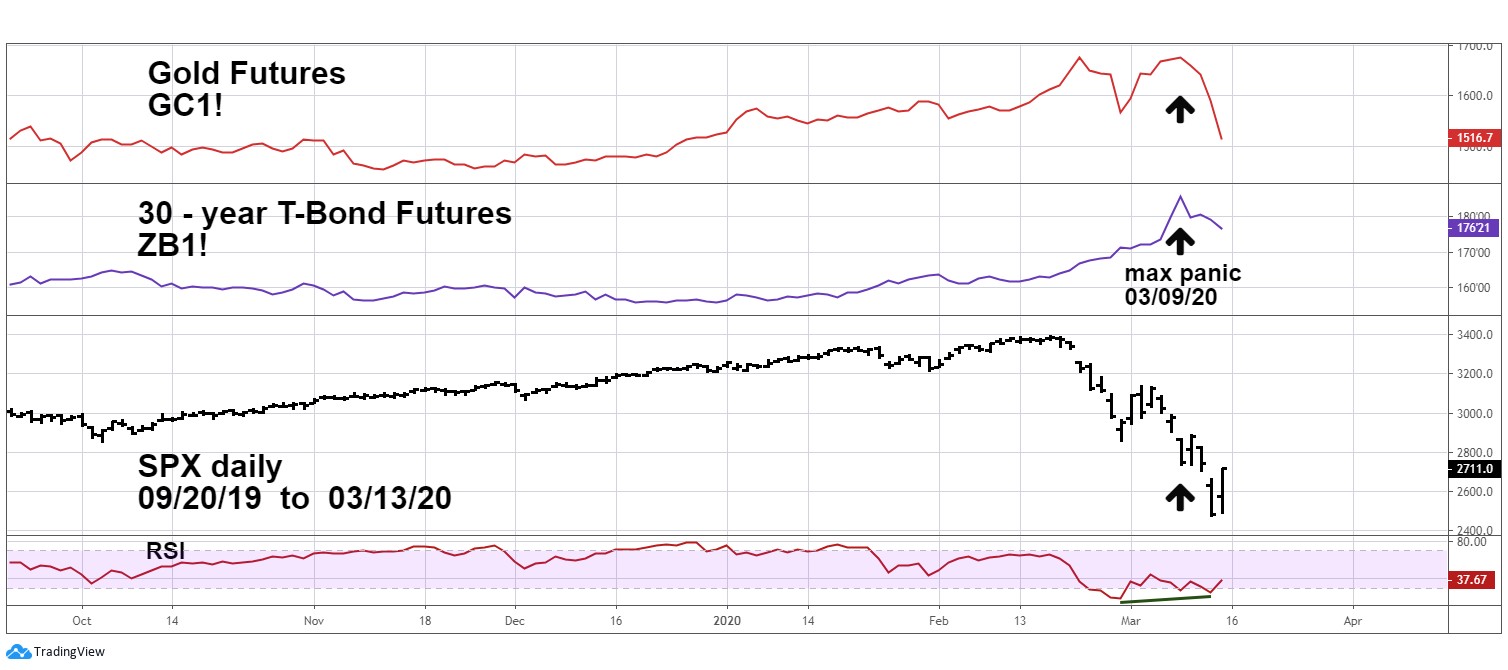
| Stocks, Bonds, and Gold It's possible the panic has already reached maximum intensity. Please see the daily SPX, Bond and Gold chart illustrated in Figure 4. On March 9 as the SPX was making a new decline low, investors were jumping into the "safe haven" investments of US Treasury Bonds and Gold with both markets making new rally highs. On March 12 the SPX made another decline low which was not accompanied by new highs in either Bonds or Gold. My March 5 article "Precious Metal Sell Signals - Part Two" noted a massive amount of evidence Gold was at, or near, a potential major top. This panic divergence with the SPX is evidence that Gold has probably peaked. The spike up in Treasury Bond prices and the corresponding plunge in rates looks eerily like what happened in December 2008. Subsequent to that price top/rate bottom there was a very sharp reversal that lasted six months. Perhaps the current divergence with the SPX is the beginning of another sharp reversal. Also note the Daily RSI for the SPX had a significant bullish divergence at the March 11 bottom. Taken together these divergences hint the SPX could be at or near a significant bottom. |

|
| Figure 4. On March 12 the SPX made another decline low which was not accompanied by new highs in either Bonds or Gold. |
| Graphic provided by: tradingview.com. |
| |
| Trading in a panic environment Panics don't happen very often and when they do occur, the news related to the market is extremely frightening. At the time it may look stupid to go against the trend, yet making a contrary trade during a panic has the potential to reap enormous profits. Focus on the weight of evidence for the market your trading. Mid-March 2020 could be a time for a contrary trade — selling Gold and Bonds, buying stocks. Further Reading: Frost A.J and Robert Prechter (1985) "Elliott Wave Principle", New Classics Library. Neill B. Humphrey (1985) "The Art of Contrary Thinking" The Caxton Printers. |
Independent investment advisor, trader and writer. He has written articles for Technical Analysis of Stocks & Commodities, Traders.com Advantage,Futuresmag.com and, Finance Magnates. Author of website Four Dimension Trading.
| Website: | www.fourdimensiontrading.com |
| E-mail address: | markrivest@gmail.com |
Click here for more information about our publications!
PRINT THIS ARTICLE

|

Request Information From Our Sponsors
- StockCharts.com, Inc.
- Candle Patterns
- Candlestick Charting Explained
- Intermarket Technical Analysis
- John Murphy on Chart Analysis
- John Murphy's Chart Pattern Recognition
- John Murphy's Market Message
- MurphyExplainsMarketAnalysis-Intermarket Analysis
- MurphyExplainsMarketAnalysis-Visual Analysis
- StockCharts.com
- Technical Analysis of the Financial Markets
- The Visual Investor
- VectorVest, Inc.
- Executive Premier Workshop
- One-Day Options Course
- OptionsPro
- Retirement Income Workshop
- Sure-Fire Trading Systems (VectorVest, Inc.)
- Trading as a Business Workshop
- VectorVest 7 EOD
- VectorVest 7 RealTime/IntraDay
- VectorVest AutoTester
- VectorVest Educational Services
- VectorVest OnLine
- VectorVest Options Analyzer
- VectorVest ProGraphics v6.0
- VectorVest ProTrader 7
- VectorVest RealTime Derby Tool
- VectorVest Simulator
- VectorVest Variator
- VectorVest Watchdog
