HOT TOPICS LIST
- MACD
- Fibonacci
- RSI
- Gann
- ADXR
- Stochastics
- Volume
- Triangles
- Futures
- Cycles
- Volatility
- ZIGZAG
- MESA
- Retracement
- Aroon
INDICATORS LIST
LIST OF TOPICS
PRINT THIS ARTICLE
by Mark Rivest
More evidence that the rally in US stocks could continue for several months.
Position: N/A
Mark Rivest
Independent investment advisor, trader and writer. He has written articles for Technical Analysis of Stocks & Commodities, Traders.com Advantage,Futuresmag.com and, Finance Magnates. Author of website Four Dimension Trading.
PRINT THIS ARTICLE
MOMENTUM
Stock Market Super Bullish Scenario - Part Two
01/17/20 01:35:54 PMby Mark Rivest
More evidence that the rally in US stocks could continue for several months.
Position: N/A
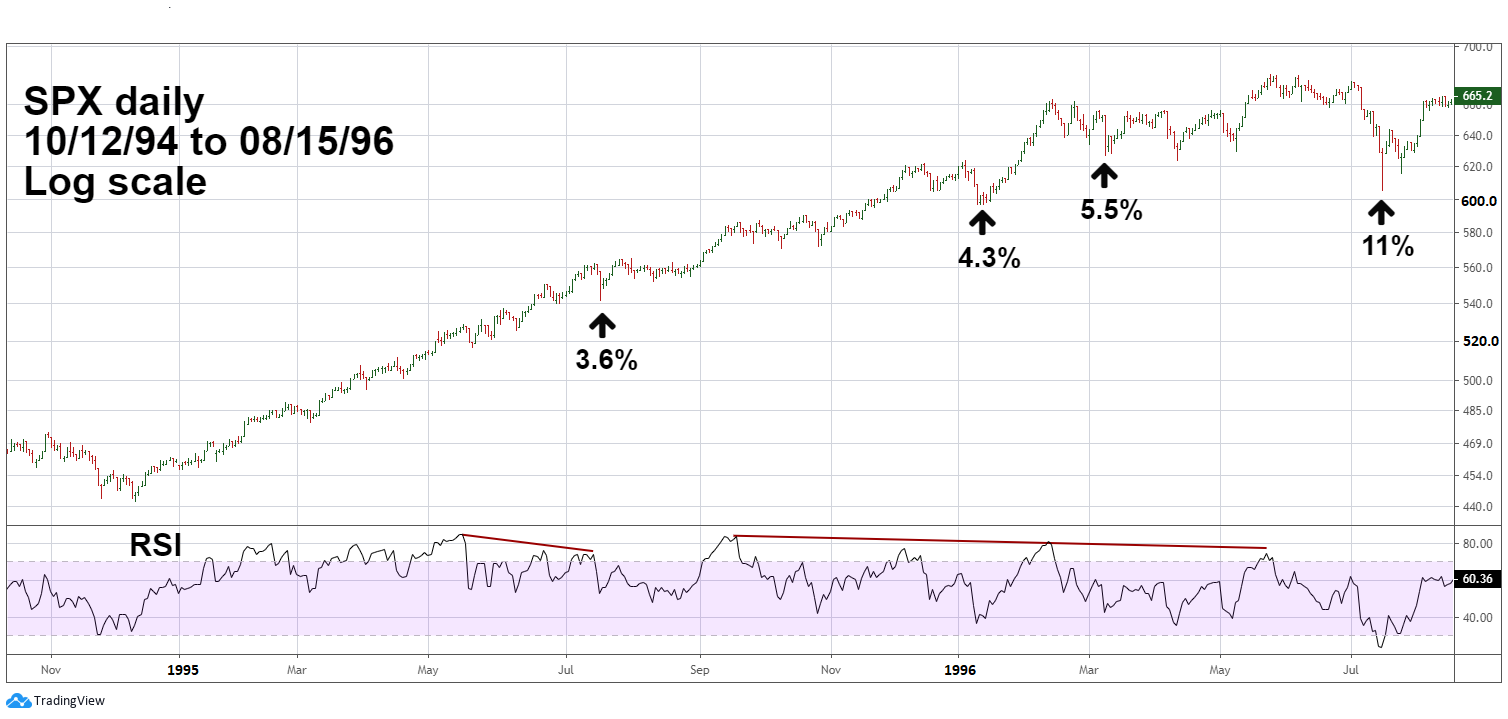
| Since early October 2019 the US stock market has been on a relentless rally. Declines have been shallow and brief. A claim could be made that the market is overbought, that a significant top is near. Examination of a bull market twenty-five years ago provides insight to what could happen in the coming months. S&P 500 - 1994 to 1996 Please see the daily S&P 500 (SPX) chart illustrated in Figure 1. From 1994 to 1996 the US stock market experienced one of the most dynamic rallies of the twentieth century. In Elliott wave terms it was the center of an extended five-wave pattern that began in October 1987 and terminated in March 2000. While the time period 1994 to 1996 illustrates the characteristics of a powerful rally, it does not imply that the current US stock rally could continue for another five years. Note that from December 1994 to July 1995 all of the declines were less than 3%. So far, in the current US rally, October 3, 2019 to January 10, 2020 has not had a 3% decline. The skeptic's that say the current rally is too extended that it can't continue at this pace need to examine 1994 to 1995. The current three months of relentless gains could stretch into seven months. The Relative Strength Index (RSI) is one of the best momentum oscillators. When used with stocks or stock indices, maximum high readings almost always imply higher prices. RSI usually needs at least one bearish divergence before a significant decline can occur. In the first half of 1995 there was a double bearish divergence that developed into only a 3.6% decline. In the subsequent ten months there was a larger degree double bearish divergence before an 11% drop happened. In steady prolonged stock rallies, RSI and other momentum oscillators can frequently give false signals. |

|
| Figure 1. Note that from December 1994 to July 1995 all of the declines were less than 3%. |
| Graphic provided by: tradingview.com. |
| |
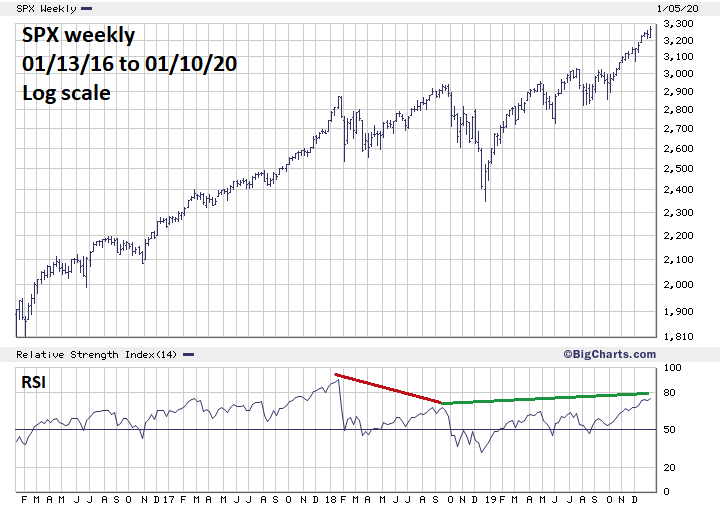
| S&P 500 - 2016 to 2020 Please see the weekly SPX chart illustrated in Figure 2. In January 2018 the SPX weekly RSI reached 90% — the highest level since the bull market began in March 2009. My January 15, 2018 article "RSI - The Super Indicator" noted this maximum reading implied a higher SPX peak later in 2018, which is what happened in September of 2018. The weekly RSI at that time was only 68% a significant bearish divergence and the prelude to the October to December decline. The subsequent rally from the December 2018 bottom has exceeded the high made in September 2018. The weekly RSI has also exceeded the level made in September and is currently at 75% — the highest level since the December 2018 bottom. However, 75% is a significant divergence from the 90% reading made in January 2018. A sign of an important peak forming? Perhaps, but what if the weekly RSI goes to 76% or 77%? As long as RSI remains below 90% there is the potential for a significant price top. The answer could come by analyzing the current bull market from the December 2018 bottom. A bearish signal could occur if in the coming months RSI remains below 90% and has a weekly bearish divergence within the cycle that began in December 2018. |

|
| Figure 2. In January 2018 the SPX weekly RSI reached 90% — the highest level since the bull market began in March 2009 |
| Graphic provided by: BigCharts.com. |
| |
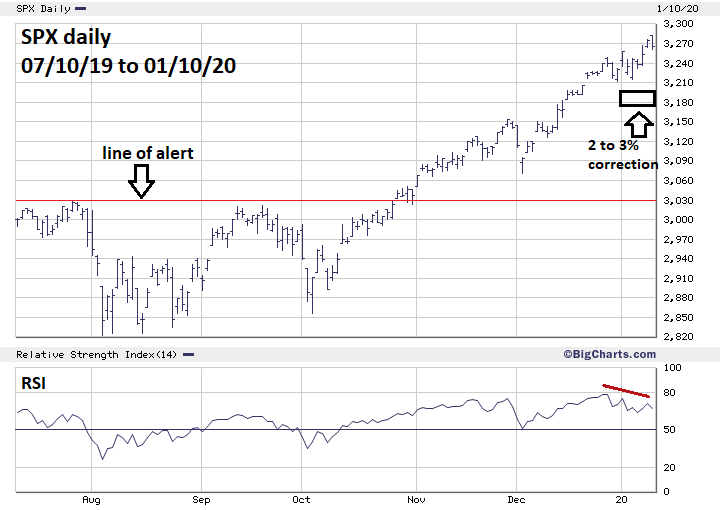
| S&P 500 - 2019 to 2020 Please see the daily SPX chart illustrated in Figure 3. As of January 10, 2020, the SPX daily RSI has a double bearish divergence implying a correction could begin soon. If the current cycle continues to follow the 1994 to 1995 model, a 2 to 3% drop is the most likely scenario. Another possibility is a decline of about 5% which could bring the SPX down to the 3120 to 3100 area assuming the current SPX all-time high at 3283 holds. The line of alert is at SPX 3028 — July 2019 rally high. If in the next several weeks SPX revisits this area, it could weaken the super bullish scenario. |

|
| Figure 3. As of January 10, 2020, the SPX daily RSI has a double bearish divergence implying a correction could begin soon. |
| Graphic provided by: BigCharts.com. |
| |
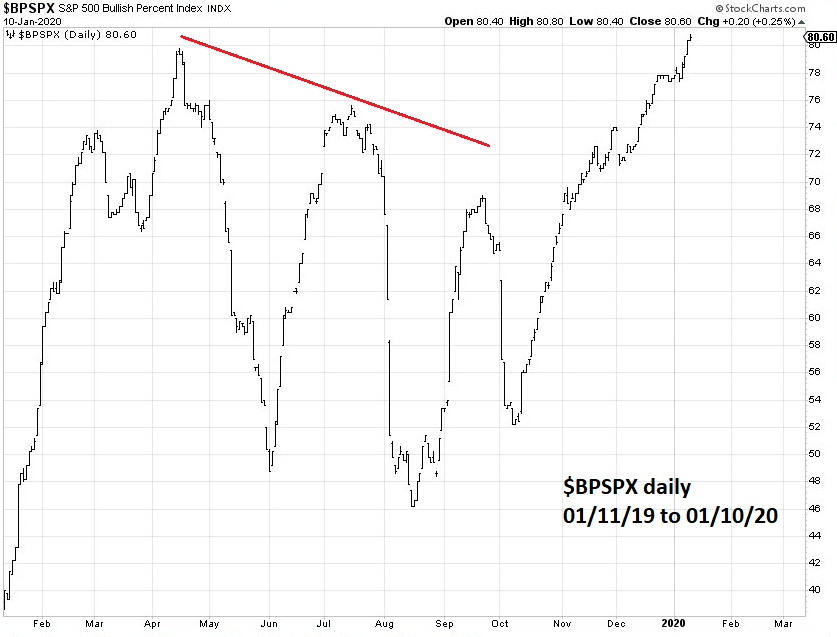
| Bullish Percent Index My December 20, 2019 article "Stock Market Momentum Cycles" noted that the S&P 500 Bullish Percent Index ($BPSPX) had a bullish signal after the index broke above a previous bearish divergence. Please see the daily S&P 500 Bullish Percent Index ($BPSPX) illustrated in Figure 4. On January 9, $BPSPX broke above the current cycle high made in April 2019. Assuming this high holds, it normally takes several months before at least one bearish divergence could signal a stock market decline. The new $BPSPX high implies the SPX could continue to rally into at least mid-2020. |

|
| Figure 4. On January 9, $BPSPX broke above the current cycle high made in April 2019. |
| Graphic provided by: StockCharts.com. |
| |
| Historical Perspective Strong steady stock market rallies don't happen very often and it's not easy to comprehend what's happening unless you've studied other strong bull markets. It's possible to make profitable trades on the short side, if there're quick — within one to three trading days. But even those nimble traders will probably have only small profits. Bears shorting a strong steady up trend will be scrounging for crumbs off the table, while the bulls feast on a banquet of buying opportunities. Further Reading: Frost A.J and Robert Prechter (1985) "Elliott Wave Principle", New Classics Library. |
Independent investment advisor, trader and writer. He has written articles for Technical Analysis of Stocks & Commodities, Traders.com Advantage,Futuresmag.com and, Finance Magnates. Author of website Four Dimension Trading.
| Website: | www.fourdimensiontrading.com |
| E-mail address: | markrivest@gmail.com |
Click here for more information about our publications!
PRINT THIS ARTICLE

Request Information From Our Sponsors
- StockCharts.com, Inc.
- Candle Patterns
- Candlestick Charting Explained
- Intermarket Technical Analysis
- John Murphy on Chart Analysis
- John Murphy's Chart Pattern Recognition
- John Murphy's Market Message
- MurphyExplainsMarketAnalysis-Intermarket Analysis
- MurphyExplainsMarketAnalysis-Visual Analysis
- StockCharts.com
- Technical Analysis of the Financial Markets
- The Visual Investor
- VectorVest, Inc.
- Executive Premier Workshop
- One-Day Options Course
- OptionsPro
- Retirement Income Workshop
- Sure-Fire Trading Systems (VectorVest, Inc.)
- Trading as a Business Workshop
- VectorVest 7 EOD
- VectorVest 7 RealTime/IntraDay
- VectorVest AutoTester
- VectorVest Educational Services
- VectorVest OnLine
- VectorVest Options Analyzer
- VectorVest ProGraphics v6.0
- VectorVest ProTrader 7
- VectorVest RealTime Derby Tool
- VectorVest Simulator
- VectorVest Variator
- VectorVest Watchdog
