HOT TOPICS LIST
- MACD
- Fibonacci
- RSI
- Gann
- ADXR
- Stochastics
- Volume
- Triangles
- Futures
- Cycles
- Volatility
- ZIGZAG
- MESA
- Retracement
- Aroon
INDICATORS LIST
LIST OF TOPICS
PRINT THIS ARTICLE
by Mark Rivest
Gold's February 24, 2020 peak could be the cusp of a bear market.
Position: Sell
Mark Rivest
Independent investment advisor, trader and writer. He has written articles for Technical Analysis of Stocks & Commodities, Traders.com Advantage,Futuresmag.com and, Finance Magnates. Author of website Four Dimension Trading.
PRINT THIS ARTICLE
PRECIOUS METALS
Precious Metal Sell Signals - Part Two
03/05/20 04:04:17 PMby Mark Rivest
Gold's February 24, 2020 peak could be the cusp of a bear market.
Position: Sell
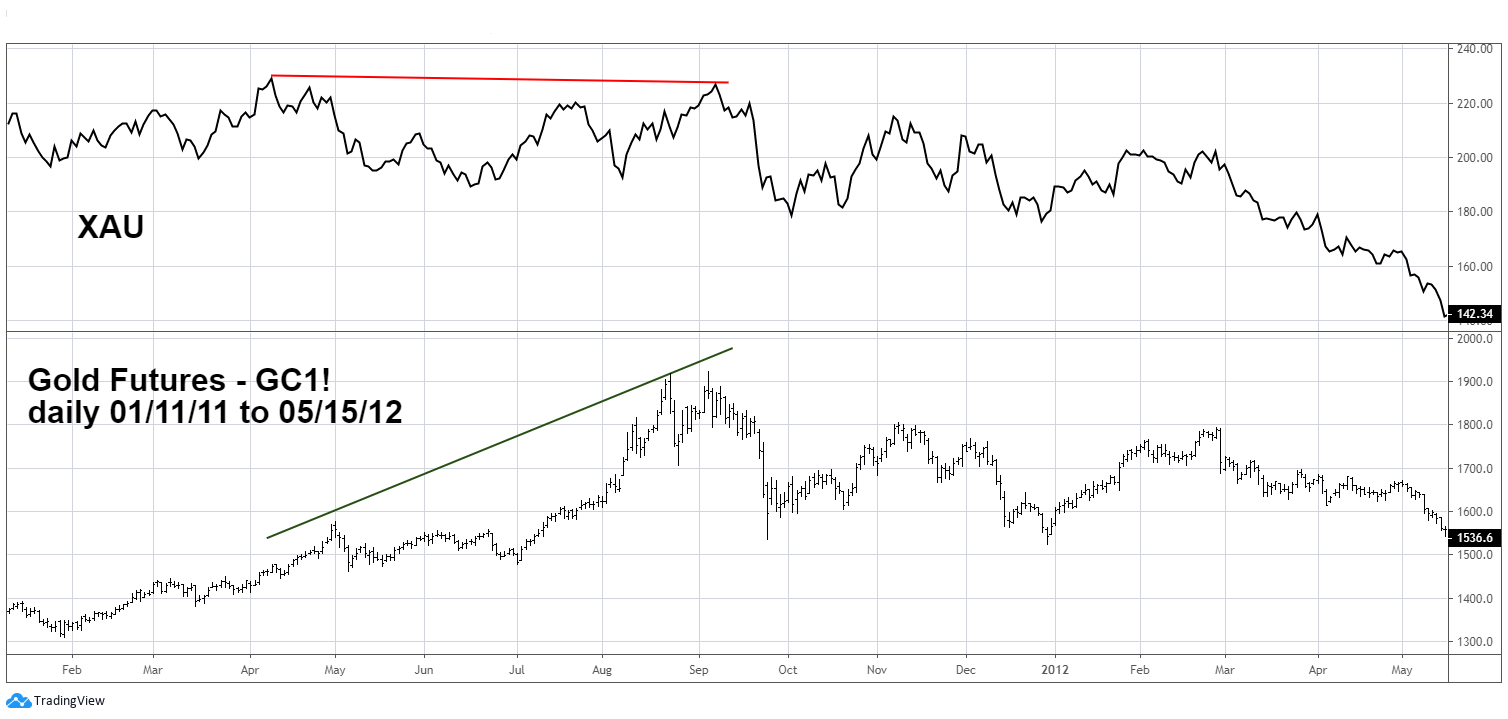
| Powerful evidence has been building for months that the precious metals group could be forming a top as significant as the 2011 peak. The dramatic spike up for Gold on February 24 may have been the climax of a rally that's lasted more than four years. A bear market lasting several years may have begun. Gold And Mining Stocks - 2011 The Gold and Silver sector index (XAU) is a great tool to confirm or not confirm precious metal bull/bear markets. For example, in Gold/Silver bull markets it's normal for Gold/Silver mining stocks to make new highs corresponding with new highs made in Gold/Silver. When the XAU fails to confirm the metals' high it could be a signal of a coming downturn for both metals and stocks. Please see the daily Gold/XAU 2011-2012 chart illustrated in Figure 1. The daily closing high for XAU in early April 2011 corresponded with the new high in Gold. Several months later Gold was significantly higher yet XAU had still failed to exceed the high it made in April. This multi-month divergence helped signal what turned out to be a major Gold high and the start of a more than four-year bear market. |

|
| Figure 1. When the XAU fails to confirm the metals' high it could be a signal of a coming downturn for both metals and stocks. |
| Graphic provided by: tradingview.com. |
| |
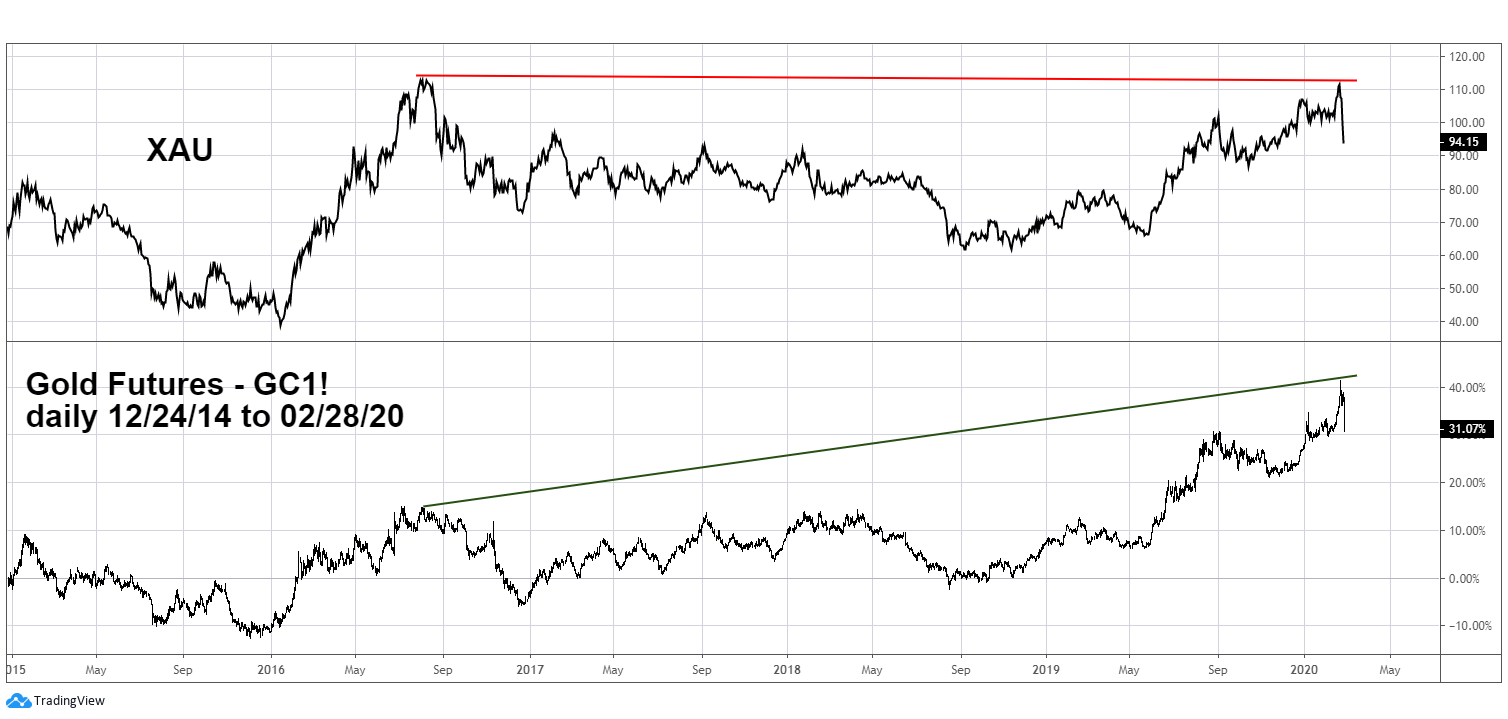
| Gold And Mining Stocks - 2020 Please see the daily Gold/XAU 2014-2020 chart illustrated in Figure 2. Fast forward to 2020, again there's a divergence between Gold and XAU. In this case the XAU price high occurred in 2016. Also note this price comparison chart shows the percentage gain of Gold relative to the XAU. Gold gained about 30% vs. no gain for XAU over a period of two and a half years. A massive divergence in price and time. |

|
| Figure 2. Gold gained about 30% vs. no gain for XAU over a period of two and a half years. |
| Graphic provided by: tradingview.com. |
| |
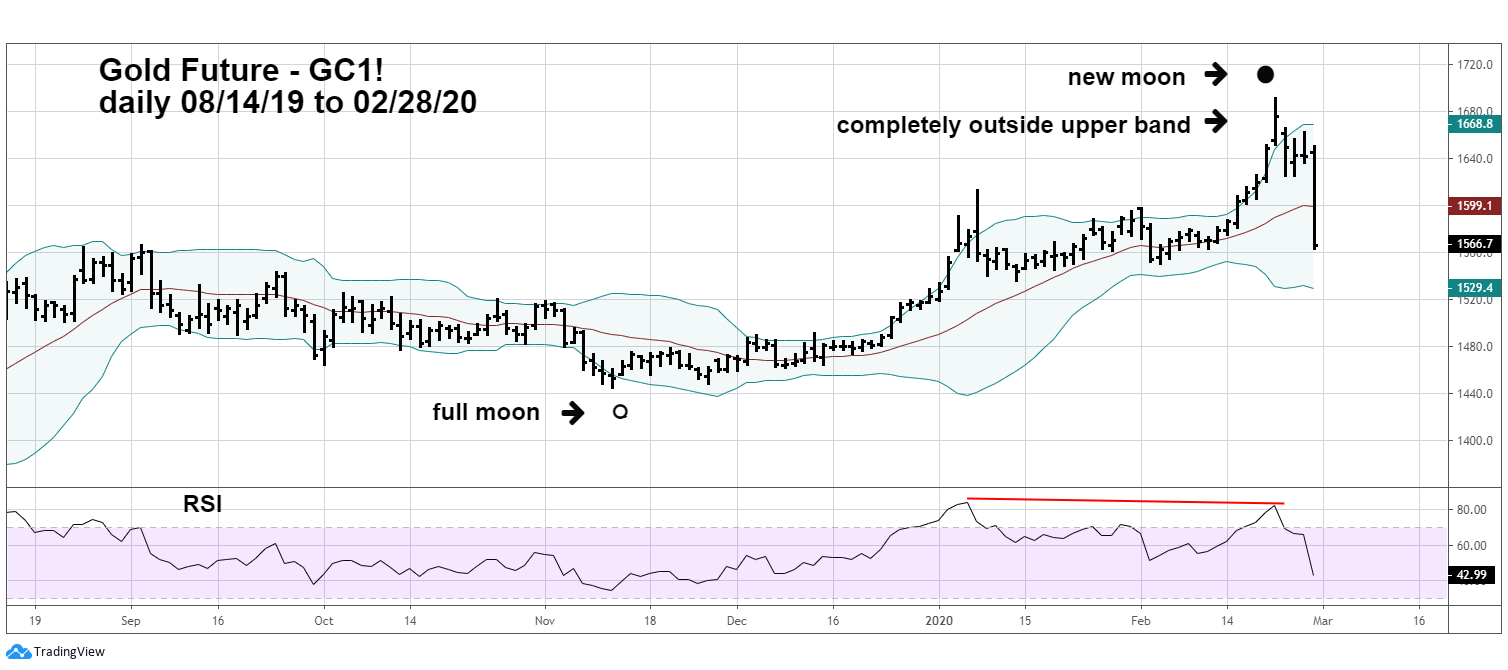
| Additional Gold Sell Signals Please see the Gold Futures chart illustrated in Figure 3. Price moves above or below upper/lower Bollinger bands usually indicate a market could be turning. Several consecutive price bars beyond the bands increases the probability of a turn. When price moves completely outside the bands, chances are extremely high of at least a short-term reversal. February 24 marked the fifth consecutive day of breaking above the upper band. Additionally, the daily price bar was completely outside of the band. Great market force is needed to achieve this phenomenon and is the sign of a market panic. For several decades traders have known that occasionally precious metal turns can occur on or near the time of a new or full moon. For the metals new moons usually indicate tops, full moons at price bottoms. There was a new moon on Sunday, February 23. The high for Gold Futures occurred at 1:00 AM PST February 24. Lunar signals usually happen during highly emotional trading periods. The concern about the virus outbreak is definitely creating a high degree of fear. Daily RSI registered a bearish divergence on the February 24 top and was confirmed by bearish divergences on the weekly and monthly charts. |

|
| Figure 3. There was a new moon on Sunday, February 23. The high for Gold Futures occurred at 1:00 AM PST February 24. |
| Graphic provided by: tradingview.com. |
| |
| Massive Bearish Evidence There's a direct relationship between the amount of evidence gathered and the degree of a market's potential turn. When you find evidence from all four market dimensions (price, time, sentiment, and momentum) the reversal could last months or years. My February 27, 2020 article "Precious Metal Sell Signals" noted Metal Commercials have very large short positions, everal momentum divergences, and a bearish Elliott wave pattern at the start of a seasonally bearish time. We can now add Bollinger Band signal at the time of a new moon with a multi-year XAU divergence. A 100% bearish situation? No, there are no absolutes in market analysis. In this case Gold has moved above a .666 or 2/3 retracement of its 2011 to 2015 bear market and is a potentially bullish signal. If Gold can rally above it's February 24 high it will open the door for a move back to the all-time high. We trade with the probabilities and the main market trend. If the massively bearish evidence is correct, traders should watch for shorting opportunities. A move down to the last precious metal bear market bottom may have begun. Further Reading: Neill B. Humphrey (1985) "The Art of Contrary Thinking" The Caxton Printers. Rivest, Mark (2020) "Fibonacci Analysis for Fun and Profit" Technical Analysis of Stocks & Commodities, Volume 38: Bonus Issue. |
Independent investment advisor, trader and writer. He has written articles for Technical Analysis of Stocks & Commodities, Traders.com Advantage,Futuresmag.com and, Finance Magnates. Author of website Four Dimension Trading.
| Website: | www.fourdimensiontrading.com |
| E-mail address: | markrivest@gmail.com |
Click here for more information about our publications!
PRINT THIS ARTICLE

Request Information From Our Sponsors
- StockCharts.com, Inc.
- Candle Patterns
- Candlestick Charting Explained
- Intermarket Technical Analysis
- John Murphy on Chart Analysis
- John Murphy's Chart Pattern Recognition
- John Murphy's Market Message
- MurphyExplainsMarketAnalysis-Intermarket Analysis
- MurphyExplainsMarketAnalysis-Visual Analysis
- StockCharts.com
- Technical Analysis of the Financial Markets
- The Visual Investor
- VectorVest, Inc.
- Executive Premier Workshop
- One-Day Options Course
- OptionsPro
- Retirement Income Workshop
- Sure-Fire Trading Systems (VectorVest, Inc.)
- Trading as a Business Workshop
- VectorVest 7 EOD
- VectorVest 7 RealTime/IntraDay
- VectorVest AutoTester
- VectorVest Educational Services
- VectorVest OnLine
- VectorVest Options Analyzer
- VectorVest ProGraphics v6.0
- VectorVest ProTrader 7
- VectorVest RealTime Derby Tool
- VectorVest Simulator
- VectorVest Variator
- VectorVest Watchdog
