HOT TOPICS LIST
- MACD
- Fibonacci
- RSI
- Gann
- ADXR
- Stochastics
- Volume
- Triangles
- Futures
- Cycles
- Volatility
- ZIGZAG
- MESA
- Retracement
- Aroon
INDICATORS LIST
LIST OF TOPICS
PRINT THIS ARTICLE
by Mark Rivest
A multi-month topping process for Gold, Silver and Platinum may be complete.
Position: Sell
Mark Rivest
Independent investment advisor, trader and writer. He has written articles for Technical Analysis of Stocks & Commodities, Traders.com Advantage,Futuresmag.com and, Finance Magnates. Author of website Four Dimension Trading.
PRINT THIS ARTICLE
PRECIOUS METALS
Precious Metal Sell Signals
02/27/20 03:51:12 PMby Mark Rivest
A multi-month topping process for Gold, Silver and Platinum may be complete.
Position: Sell
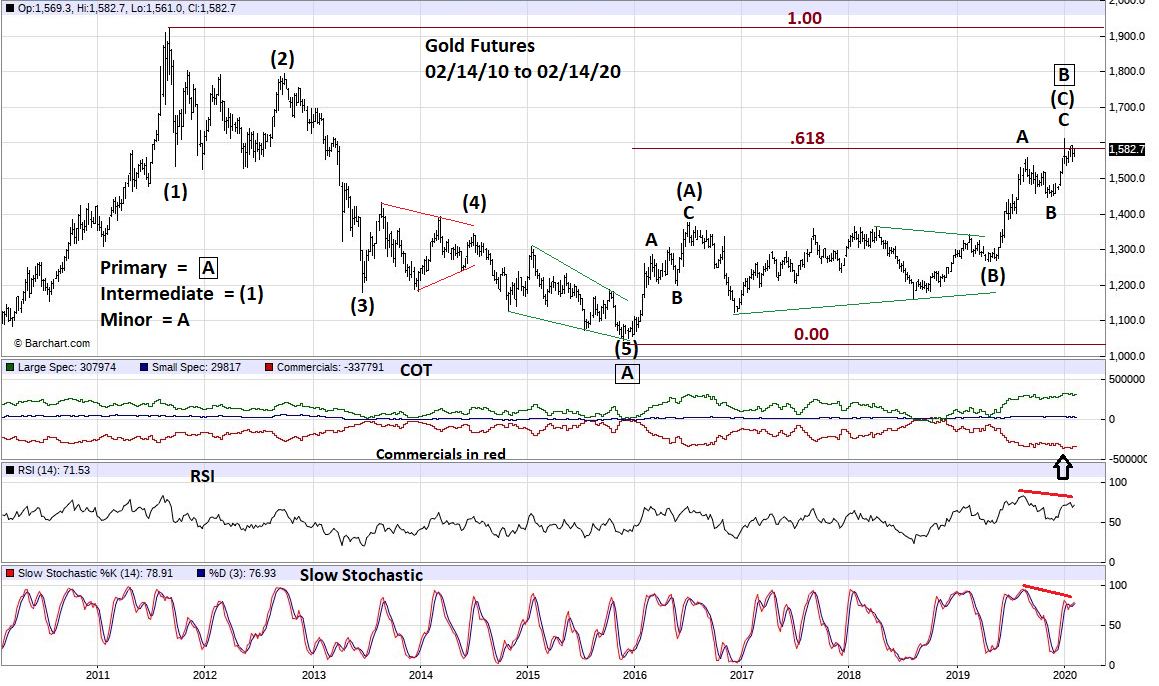
| The ability to discover potential market turns requires evidence, the probabilities of success are directly related to the amount of evidence gathered. Comprehensive analysis requires the study of all four market dimensions: price, time, sentiment, and momentum. When factors from all four dimensions are heavily weighted in one direction, a significant market turn could be in the making. Evidence from the precious metals group indicate a decline lasting months, or even years, may have already begun. Gold Of the precious metals, Gold's upside performance has been the strongest — having retraced just marginally above important resistance .618 of its 2011 to 2015 bear phase. Please see the weekly Gold futures chart illustrated in Figure 1. This is an update to the chart shown in my October 15, 2019 article "Gold Below $1000 - Part Two". That article noted that Gold was seasonally bearish from October to December. Gold declined into November, went sideways through mid-December and rallied into early January. Since the last rally high, seasonal factors have failed to move Gold to a new top. Most significantly, the weekly RSI in January had a bearish divergence from the extremely overbought reading made at Gold's September 2019 top. The most powerful bearish evidence comes from the Commitment of Traders (COT) weekly report. The report breaks traders into three categories: Large Speculators, Small Speculators, and Commercials. The Commercials have the most money and knowledge, this is the group to follow. At Gold's September top the Commercials had their largest short position in twenty-five years. At the January peak Commercials had an even larger short position. Gold is seasonally bearish from mid-February until April. |

|
| Figure 1. The most powerful bearish evidence comes from the Commitment of Traders (COT) weekly report. |
| Graphic provided by: Barchart.com. |
| |
| Platinum Please see the monthly Platinum chart illustrated in Figure 2. Platinum is relatively more bearish than Gold and Silver. In the rally from 2008 to 2011 Platinum was unable to exceed its all-time high made in February 2008. Gold and Silver were able to exceed their respective 2008 peaks by a wide margin. Monthly Slow Stochastic at Platinum's January 2020 high is the same level as recorded at the mid-2016 peak. However, this indicator has yet to reach the overbought bought level of 80% implying the possibility of more upside action. Arguing against higher prices is the reading from Platinum Commercials who are currently near their largest short position in at least twenty years. If Platinum resumes its downside trek, it could find support in the 755-756 area which has held since the intermediate bottom made back in April 2004. |

|
| Figure 2. Platinum is relatively more bearish than Gold and Silver. |
| Graphic provided by: Barchart.com. |
| |
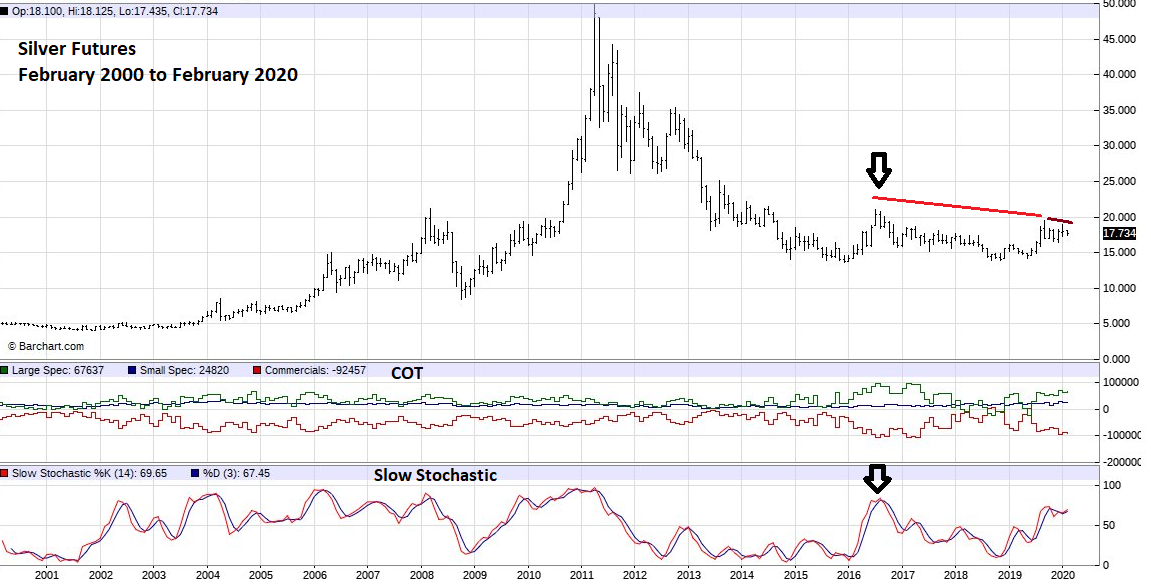
| Silver Please see the monthly Silver chart illustrated in Figure 3. In the short-term, Silver is weaker relative to both Gold and Platinum. Not only is Silver below its 2016 top, its January 2020 rally high failed to exceed the September 2019 peak. Slow Stochastic is in the area it reached at the 2016 price top, and the Commercial short position is near the largest level in twenty years. |

|
| Figure 3. Slow Stochastic is in the area it reached at the 2016 price top. |
| Graphic provided by: Barchart.com. |
| |
| Summary Price - Gold has reached .618 retrace of the 2011 to 2015 decline. Sentiment - Gold, Silver, and Platinum Commercials have the largest short positions in decades. Time - Gold seasonally bearish mid-February to April. Momentum - Gold weekly RSI bearish divergence, Platinum and Silver monthly Slow Stochastic at levels of price peaks in 2016. Additional momentum evidence comes from the relationship between the three metals, what I call, "the rule of the majority." Gold has exceeded its 2016 high while Platinum and Silver have failed to exceed their 2016 peaks. The truth is with the majority, Silver and Platinum are probably continuing bearish trends from all-time highs and Gold is likely to follow. If the next bearish phase is commencing, how long could it last? Gold holds some interesting clues. The bear phase from its all-time high in 2011 lasted until 2015 — four years. Assuming a significant Gold peak is in place, or could be soon, the rally from 2015 would be five years, a Fibonacci sequence number. It's possible the next bear phase could continue four years, equaling the first phase. If this scenario plays out the entire secular Gold bear market would be thirteen years, a Fibonacci sequence number. Perhaps 2024 could be a major bottom for Gold and the other precious metals. Further Reading: Frost A.J and Robert Prechter (1985) "Elliott Wave Principle", New Classics Library. Prechter Jr. R. Robert (2003) "Beautiful Pictures", New Classics Library. Rivest Mark (2020) "The Sentiment Dimension" Technical Analysis of Stocks & Commodities, Volume 38 February. |
Independent investment advisor, trader and writer. He has written articles for Technical Analysis of Stocks & Commodities, Traders.com Advantage,Futuresmag.com and, Finance Magnates. Author of website Four Dimension Trading.
| Website: | www.fourdimensiontrading.com |
| E-mail address: | markrivest@gmail.com |
Click here for more information about our publications!
PRINT THIS ARTICLE

Request Information From Our Sponsors
- StockCharts.com, Inc.
- Candle Patterns
- Candlestick Charting Explained
- Intermarket Technical Analysis
- John Murphy on Chart Analysis
- John Murphy's Chart Pattern Recognition
- John Murphy's Market Message
- MurphyExplainsMarketAnalysis-Intermarket Analysis
- MurphyExplainsMarketAnalysis-Visual Analysis
- StockCharts.com
- Technical Analysis of the Financial Markets
- The Visual Investor
- VectorVest, Inc.
- Executive Premier Workshop
- One-Day Options Course
- OptionsPro
- Retirement Income Workshop
- Sure-Fire Trading Systems (VectorVest, Inc.)
- Trading as a Business Workshop
- VectorVest 7 EOD
- VectorVest 7 RealTime/IntraDay
- VectorVest AutoTester
- VectorVest Educational Services
- VectorVest OnLine
- VectorVest Options Analyzer
- VectorVest ProGraphics v6.0
- VectorVest ProTrader 7
- VectorVest RealTime Derby Tool
- VectorVest Simulator
- VectorVest Variator
- VectorVest Watchdog
