

HOT TOPICS LIST
- MACD
- Fibonacci
- RSI
- Gann
- ADXR
- Stochastics
- Volume
- Triangles
- Futures
- Cycles
- Volatility
- ZIGZAG
- MESA
- Retracement
- Aroon
INDICATORS LIST
LIST OF TOPICS
PRINT THIS ARTICLE
by Mark Rivest
See why Gold could be entering a new bear market.
Position: Sell
Mark Rivest
Independent investment advisor, trader and writer. He has written articles for Technical Analysis of Stocks & Commodities, Traders.com Advantage,Futuresmag.com and, Finance Magnates. Author of website Four Dimension Trading.
PRINT THIS ARTICLE
SEASONAL TRADING
Gold Below $1000 - Part Two
10/15/19 06:23:52 PMby Mark Rivest
See why Gold could be entering a new bear market.
Position: Sell
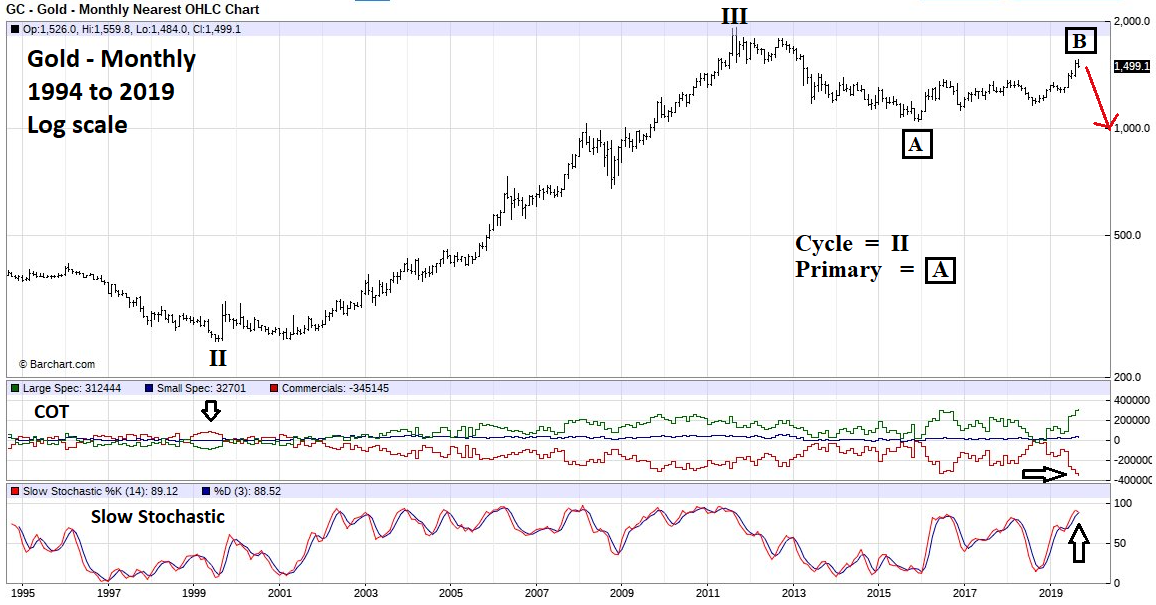
| In November 2018 Gold was trading in the low $1200 area with seasonal and momentum factors implying a move below $1000 could be underway. However, a powerful signal from the Commitment of Traders (COT) report indicated the most knowledgeable group of Gold traders — the Commercials — were suspecting higher prices. In September 2019 there's another signal from the Commercials, this time bearish. Gold - Monthly Commitment of Trader reports for Futures are issued weekly. The data breaks traders into three categories: Large Speculators, Small Speculators, and Commercials. The group with the most money and knowledge are the Commercials — this is the group you want to follow. My November 15, 2018 article "Gold Below $1000" noted that seasonal and momentum factors could bring Gold below $1000 because November and December are seasonally bearish. Additionally, weekly Stochastic had just reached overbought territory and was rolling over. However, the correct signal came from the Commercials which came close to net long in October 2018. Please see the monthly Gold Futures chart illustrated in Figure 1. My November 15, 2018 article speculated that a new decline into December 2018 bringing Gold below $1000 could see the Commercials take a net long position. The Commercials, shown on the red line, are almost always net short, insurance in case of price declines. It's extraordinary if they go net long, note the most significant net long position was in 1999 at the major Gold bottom. The situation in September 2019 is the complete opposite as the Commercials now have the largest net short position in over twenty-five years! The long-term Elliott wave count from the all-time high made in September 2011 at $1923 implies a multi-year Zigzag pattern reaching to at least the bottom made in late November 2015 at $1046. |
|
| Figure 1. Commercials now have the largest net short position in over twenty-five years! |
| Graphic provided by: Barchart.com. |
| |
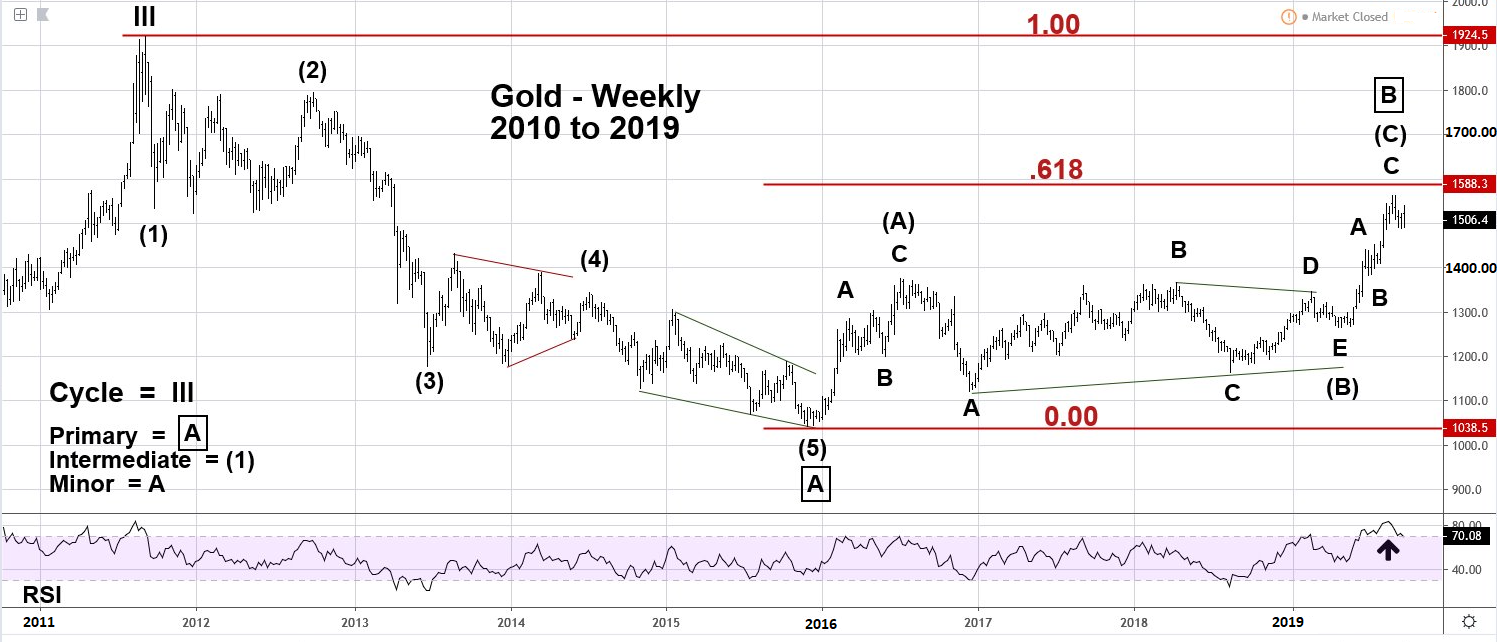
| Gold - Weekly Please see the weekly Gold Futures chart illustrated in Figure 2. Gold's 2011 to 2015 decline took the form of a classic Elliott five-wave pattern. The supposed first wave is sharp and short, typically of a kickoff decline in a larger bear market. The supposed third wave is elongated and makes the most downside progress of the three motive waves (1, 3 and 5). The supposed fourth wave looks like a Horizontal Triangle; this pattern only appears in the wave "4" position of motive waves and in wave "B" of corrective waves. The fifth wave appears to be an Ending Diagonal Triangle which terminate a larger trend. They typically happen in wave "5" and sometimes in "C" waves. The corrections subsequent to a five-wave motive pattern usually come in three phases. The movement up from the November 2015 bottom appears to be a Double Zigzag, with a Horizontal Triangle separating the two Zigzags. The first Zigzag from late 2015 to mid-2016 is illustrated as wave (A) followed by a Horizontal Triangle wave (B) that may have terminated in April of 2019. Wave (C) constitutes the second Zigzag pattern. Evidence suggesting the corrective pattern is complete comes from the Price and Momentum dimensions. Price: Fibonacci .618 retrace of the entire 2011 to 2015 bear market is at $1588.20 so far, the high on the weekly futures chart is 1566.20, within leeway of the important resistance. Momentum: Weekly RSI has reached the highest level since the all-time high made in 2011 and complements the monthly Stochastics which reached overbought territory as noted in Figure 1. |
|
| Figure 2. Gold�s 2011 to 2015 decline took the form of a classic Elliott five�wave pattern. |
| Graphic provided by: tradingview.com. |
| |
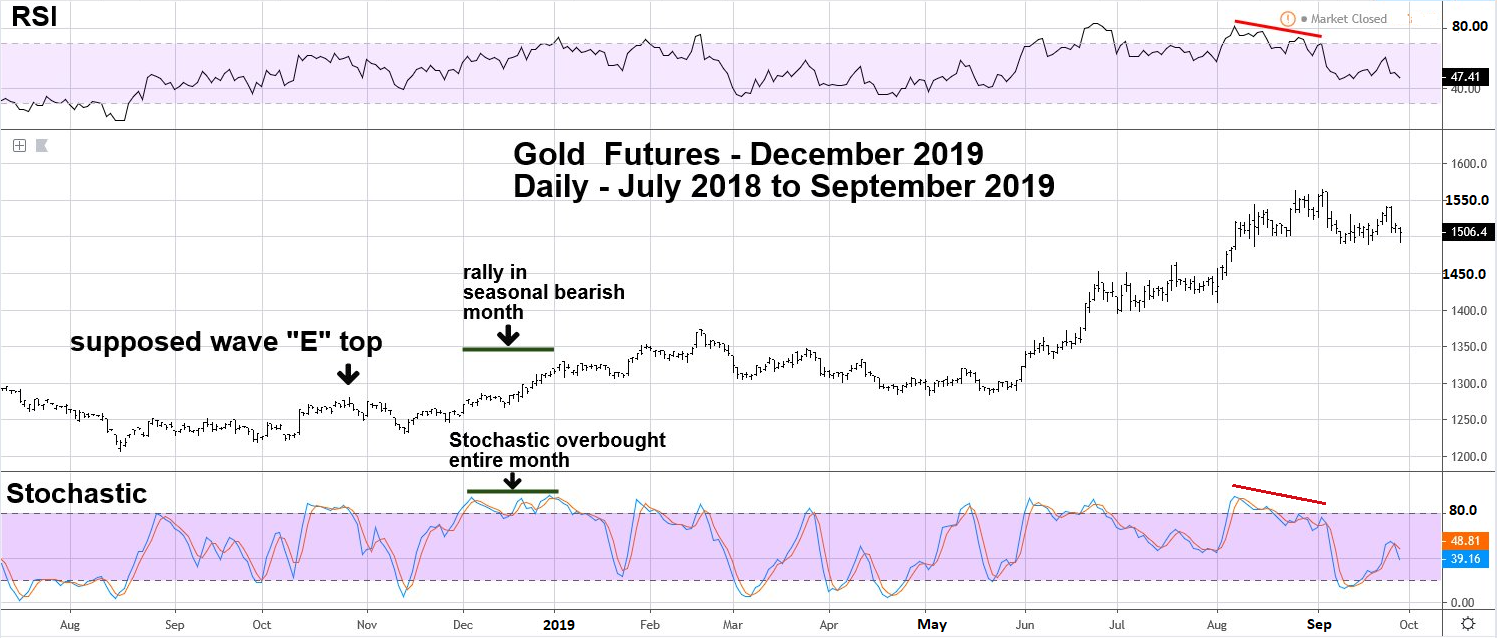
| Gold - Daily Please see the daily December 2019 Gold Futures chart illustrated in Figure 3. My November 15, 2018 article noted that Gold is seasonally bearish November to December. The bearish time zone usually runs from October to December. Momentum evidence in the form of weekly and daily Stochastic had reached overbought and were rolling over to the downside. The two factors of bearish seasonality and momentum outweighed the one bullish factor of Commercials nearing a net long position. In making forecasts go with the weight of the evidence, which in this case was bearish. The first hint the forecast could be wrong was when price exceeded the high of what could have been wave "E" of a completed Inverse Horizontal Triangle from the November 2015 bottom. This is not conclusive because a larger more complex wave "E" could have still been under construction. A stronger piece of bullish evidence was when the rally was happening Gold was rising in a normally bearish month, implying some larger up-movement was underway. Additional evidence came from the daily Stochastic which stayed overbought the entire month of December. Stochastic staying overbought for extended periods of time usually means the bulls are in command. More recently, note that both the daily RSI and Stochastic had significant bearish divergences at Gold's September 2019 peak. |
|
| Figure 3. Both the daily RSI and Stochastic had significant bearish divergences at Gold�s September 2019 peak. |
| Graphic provided by: tradingview.com. |
| |
| Summary Commercials have the largest net short position in over twenty-five years just before the a seasonally bearish time. A completed Elliott wave corrective pattern near major Fibonacci resistance with long term momentum indicators in the overbought zone strongly suggests a major move down may have begun. If the long-term Elliott wave count is correct, Gold could reach at least the bottom made in November 2015. If that support is broken, Gold could gravitate to round number support at $1000. A break below this historic number could be viewed by the crowd as super bearish. When the crowd freaks out at major support breaks, sometimes it's an indication of a fake out. With Gold trading at the low $1500 area in late September 2019, it's unlikely Gold could reach the low $1000 area in just a few months. The Cycle "II" Gold bear market from the peak made in the year 1980 lasted nineteen to twenty-one years, depending on which double bottom, either 1999 or 2001. Averaging the two equates to a twenty-year bear market. Perhaps the Cycle wave "IV" bear market could be a Fibonacci 50% of Cycle wave "II". Ten years after Gold's 2011 all-time high targets the year 2021 as a possible end to a multi-year decline. Evidence from all four market dimensions of Price, Time, Sentiment, and Momentum strongly suggest that the kickoff phase of the next bear market may have begun. There are no certainties in the markets. If Gold continues to rally during the bearish months of October to December it implies the bull movement could last much longer. Further Reading: Frost A.J and Robert Prechter (1985) "Elliott Wave Principle", New Classics Library. |
Independent investment advisor, trader and writer. He has written articles for Technical Analysis of Stocks & Commodities, Traders.com Advantage,Futuresmag.com and, Finance Magnates. Author of website Four Dimension Trading.
| Website: | www.fourdimensiontrading.com |
| E-mail address: | markrivest@gmail.com |
Click here for more information about our publications!
PRINT THIS ARTICLE

Request Information From Our Sponsors
- StockCharts.com, Inc.
- Candle Patterns
- Candlestick Charting Explained
- Intermarket Technical Analysis
- John Murphy on Chart Analysis
- John Murphy's Chart Pattern Recognition
- John Murphy's Market Message
- MurphyExplainsMarketAnalysis-Intermarket Analysis
- MurphyExplainsMarketAnalysis-Visual Analysis
- StockCharts.com
- Technical Analysis of the Financial Markets
- The Visual Investor
- VectorVest, Inc.
- Executive Premier Workshop
- One-Day Options Course
- OptionsPro
- Retirement Income Workshop
- Sure-Fire Trading Systems (VectorVest, Inc.)
- Trading as a Business Workshop
- VectorVest 7 EOD
- VectorVest 7 RealTime/IntraDay
- VectorVest AutoTester
- VectorVest Educational Services
- VectorVest OnLine
- VectorVest Options Analyzer
- VectorVest ProGraphics v6.0
- VectorVest ProTrader 7
- VectorVest RealTime Derby Tool
- VectorVest Simulator
- VectorVest Variator
- VectorVest Watchdog