

HOT TOPICS LIST
- MACD
- Fibonacci
- RSI
- Gann
- ADXR
- Stochastics
- Volume
- Triangles
- Futures
- Cycles
- Volatility
- ZIGZAG
- MESA
- Retracement
- Aroon
INDICATORS LIST
LIST OF TOPICS
PRINT THIS ARTICLE
by Mark Rivest
See what factors could bring Gold below important support.
Position: N/A
Mark Rivest
Independent investment advisor, trader and writer. He has written articles for Technical Analysis of Stocks & Commodities, Traders.com Advantage,Futuresmag.com and, Finance Magnates. Author of website Four Dimension Trading.
PRINT THIS ARTICLE
ELLIOTT WAVE
Gold Below $1000
11/15/18 03:57:49 PMby Mark Rivest
See what factors could bring Gold below important support.
Position: N/A
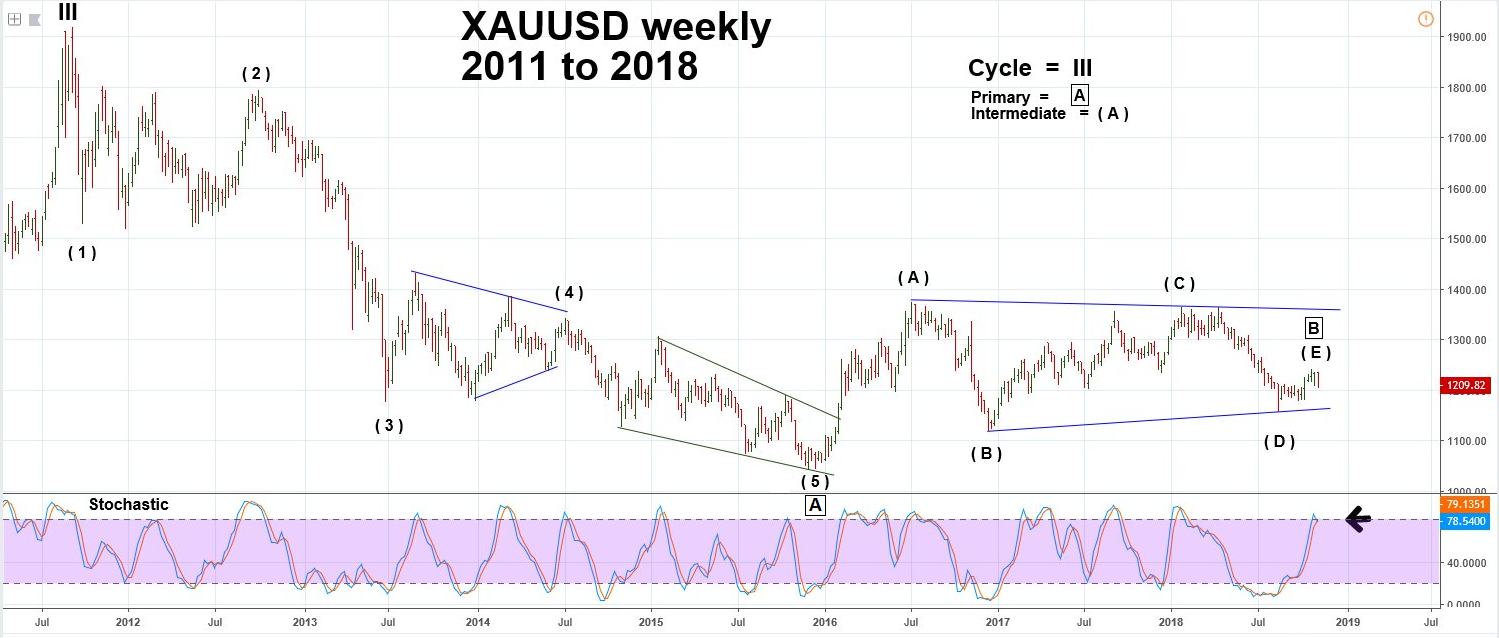
| Since 2009, Gold (XAUUSD) has traded above $1000. Seasonal and momentum factors hint that very soon it could break this level. Elliott wave and Fibonacci analysis point to two areas where the next support could be if $1000 is broken. Gold Weekly The Gold bear market from 2011 to 2015 provides an excellent example of what appears to be an Elliott five wave decline. Please see weekly Gold in US dollars (XAUUSD) chart illustrated in Figure 1. My November 8 article, "Elliott Wave Interpretations", explained Horizontal and Ending Diagonal Triangles. Intermediate wave (4) is a textbook Horizontal Triangle, the subsequent decline into the late 2015 bottom took the form of an Ending Diagonal Triangle (EDT). After an EDT is complete, markets will typically retrace back to at least the EDT's point of origin, which in this case is 1345.09. The rally after the bottom in December 2015 terminated at 1375.03. Since that peak in July of 2016, Gold has been in a contracting range which could be another Horizontal Triangle. The size of the supposed wave (E) is small compared to the other sub waves of the triangle. However, sometimes wave "E" can be sneaky by finishing quickly, two factors provide evidence that wave (E) could be complete. Golds seasonal patterns are bearish November to December. Note the late year declines in 2013, 2015, 2016, and 2017. Also, momentum could be bearish; note that the relatively small rally from August was able to bring the weekly Stochastic to the overbought zone. If a Horizontal Triangle is complete at the recent top of 1243.49 there could be a post triangle thrust down. Usually these trusts are about the size of the triangles widest part, in this case the length of wave (A) 328.71. Subtracting this from the wave (E) peak at 1243.49 targets 914.78. |
|
| Figure 1. Gold's seasonal patterns are bearish November to December. Note the late year declines in 2013, 2015, 2016, and 2017. |
| Graphic provided by: tradingview.com. |
| |
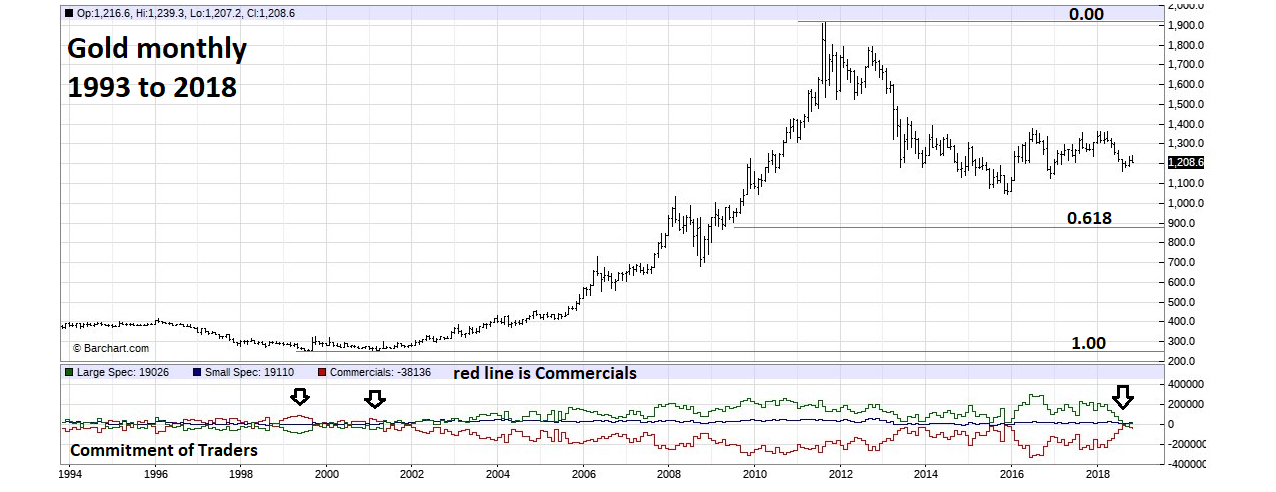
| Gold Monthly The Gold monthly futures chart illustrated in Figure 2 shows another potential for a bottom at 889.80. This is a .618 retrace of the bull market from 1999 to 2011. The lower part of this chart shows the Commitment of Traders for Gold futures. This weekly data breaks traders into three categories: Large speculators, Small speculators, and Commercials. The group with the most money and knowledge of the Gold market are the Commercials; this is the group you want to follow. Note that the Commercials are almost always net short Gold. The only exceptions were in 1999 and 2001 when they briefly were net long at what turned out to be a major double bottom. A case could be made in mid-November with Commercials at their smallest net short position since the late 2015 bottom that an important Gold bottom is already in place. If Gold, however, declines into a seasonal December bottom, watch what the Commercials are doing. If they move to a net long position on a December decline it could be a powerful signal that a very important bottom could be forming. |
|
| Figure 2. Note that the Commercials are almost always net short Gold. |
| Graphic provided by: Barcharts.com. |
| |
| Silver Weekly Please see the weekly Silver in US dollars (XAGUSD) illustrated in Figure 3. You always want to buy strength and sell weakness. Silver since its last major top has been much weaker relative to Gold. If a significant bottom is in place or soon could be, do not go long Silver, its potential upside vs. Gold will probably continue to lag. Near term Silver is hinting there could be more downside action. Silver on November 9 was only 3.3% above its late 2015 bottom — Gold was 15.3% above its late 2015 bottom. If the Silver bears make an attack and break the 2015 bottom it could trigger a Gold sell off. |

|
| Figure 3. If the Silver bears make an attack and break the 2015 bottom it could trigger a Gold sell off. |
| Graphic provided by: tradingview.com. |
| |
| Summary Gold's December 2015 bottom was at 1046.33. If it's broken the bears could then push below 1000. This is very important round number support. It's possible a move below 1000 could be perceived as extremely bearish. However, Fibonacci analysis indicates an important bottom could form near 914 or 889. Regardless of the price level, if Gold can break below 1000 the two most important factors are the calendar and the Commitment of Traders report. If Gold is below 1000 in December and the Commitment of Traders show Commercials net long, a potential bottom could be at any point between 990 and 880. Further Reading: Frost A.J and Robert Prechter (1985) "Elliott Wave Principle", New Classics Library. |
Independent investment advisor, trader and writer. He has written articles for Technical Analysis of Stocks & Commodities, Traders.com Advantage,Futuresmag.com and, Finance Magnates. Author of website Four Dimension Trading.
| Website: | www.fourdimensiontrading.com |
| E-mail address: | markrivest@gmail.com |
Click here for more information about our publications!
PRINT THIS ARTICLE

Request Information From Our Sponsors
- StockCharts.com, Inc.
- Candle Patterns
- Candlestick Charting Explained
- Intermarket Technical Analysis
- John Murphy on Chart Analysis
- John Murphy's Chart Pattern Recognition
- John Murphy's Market Message
- MurphyExplainsMarketAnalysis-Intermarket Analysis
- MurphyExplainsMarketAnalysis-Visual Analysis
- StockCharts.com
- Technical Analysis of the Financial Markets
- The Visual Investor
- VectorVest, Inc.
- Executive Premier Workshop
- One-Day Options Course
- OptionsPro
- Retirement Income Workshop
- Sure-Fire Trading Systems (VectorVest, Inc.)
- Trading as a Business Workshop
- VectorVest 7 EOD
- VectorVest 7 RealTime/IntraDay
- VectorVest AutoTester
- VectorVest Educational Services
- VectorVest OnLine
- VectorVest Options Analyzer
- VectorVest ProGraphics v6.0
- VectorVest ProTrader 7
- VectorVest RealTime Derby Tool
- VectorVest Simulator
- VectorVest Variator
- VectorVest Watchdog