

HOT TOPICS LIST
- MACD
- Fibonacci
- RSI
- Gann
- ADXR
- Stochastics
- Volume
- Triangles
- Futures
- Cycles
- Volatility
- ZIGZAG
- MESA
- Retracement
- Aroon
INDICATORS LIST
LIST OF TOPICS
PRINT THIS ARTICLE
by Mark Rivest
Tools that can help differentiate Elliott wave patterns.
Position: N/A
Mark Rivest
Independent investment advisor, trader and writer. He has written articles for Technical Analysis of Stocks & Commodities, Traders.com Advantage,Futuresmag.com and, Finance Magnates. Author of website Four Dimension Trading.
PRINT THIS ARTICLE
ELLIOTT WAVE
Elliott Wave Interpretations
11/08/18 02:19:44 PMby Mark Rivest
Tools that can help differentiate Elliott wave patterns.
Position: N/A
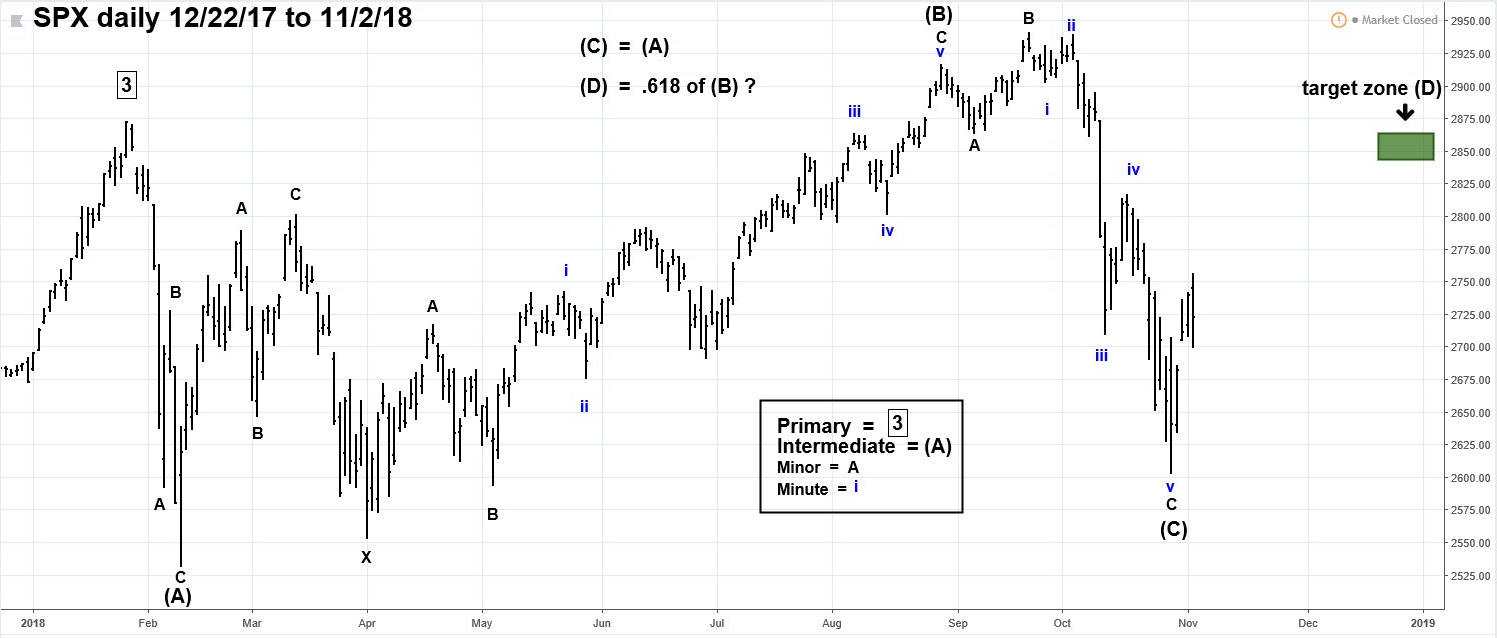
| Elliott wave theory is a subjective methodology because there is always at least one alternate count, sometimes many. To discover the correct market path, objective tools must be used in conjunction with Elliott wave analysis. Recent examples from the US and Chinese stock markets illustrate how to find the best wave count. S&P 500 In 2018 The mini crash in February 2018 is a perfect example of why relying solely on Elliott wave patterns could lead to an incorrect interpretation of the stock markets course. Please see the S&P 500 (SPX) daily chart illustrated in Figure 1. The February decline was very dynamic, almost a straight down move which is characteristic of an Elliott Impulse wave which moves in the direction of the main trend. Using only Elliott analysis, it would be easy to interpret this drop as just the first wave down of a larger developing bear market. However, momentum evidence, specifically the RSI indicator, on all time scales reached its maximum level in January. My January 15 article "RSI -The Super Indicator" discussed why a high overbought RSI reading is bullish. The SPX subsequent move above its January top is yet another example of RSI predictive value. Fibonacci analysis is another tool to discovering the correct Elliott wave count. My November 1 article "Stock Market Seasonal Patterns" noted that the SPX could be forming an Elliott wave Ending Diagonal Triangle (EDT). This count is still valid however the SPX could also be forming a Horizontal Triangle. Examples of these triangle types are illustrated in Figure 2. The SPX October drop held above 2594.62, which is the point of origin for the supposed EDT, however examining the lengths of the February and October free falls provides an important clue. In February the SPX fell 340.18 points, while October declined 337.37 points — a difference of only 2.81 points. Both waves are approximately equal a Fibonacci ratio. The most common Fibonacci relationships for Horizontal Triangles is among alternate waves. Example wave "A" is related to wave "C", wave "C" is related to wave "E". If the Horizontal Triangle count is correct, then the next interim peak could come at the SPX 2850 area. |
|
| Figure 1. The February decline was very dynamic almost a straight down move which is characteristic of an Elliott Impulse wave which moves in the direction of the main trend. |
| Graphic provided by: Tradingview.com. |
| |
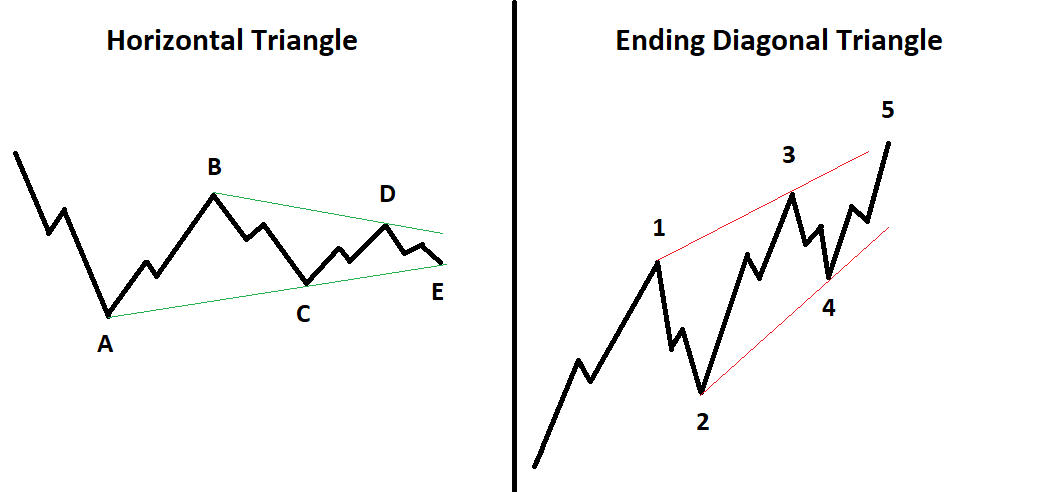
| Horizontal And Ending Triangles Figure 2 illustrates examples of a Horizontal Triangle and an Ending Diagonal Triangle. Horizontal Triangles correct the primary trend. They only occur in the fourth wave position of motive waves and in wave "B" of (A - B - C) corrections. Each of the five sub waves are three wave structures. Many Horizontal Triangles contract as shown in this illustration. However, it's common for wave "B" to exceed the termination point of wave "A", referred to as running triangles. The supposed SPX Horizontal Triangle forming from the January top is an example of a running triangle. Ending Diagonal Triangles occur at termination points of larger patterns, indicating exhaustion of the larger movement. They take a wedge shape between two converging lines. EDTs are in fifth waves and wave "C" of corrective patterns. Each sub wave, including waves 1, 3, and 5, have three-wave structures. The fourth wave of an EDT almost always overlaps into the area of the first wave. Frequently, the fifth wave could overthrow the trend line connecting the termination points of waves "one" and "three". |
|
| Figure 2. Horizontal Triangles correct the primary trend. Ending Diagonal Triangles occur at termination points. |
| Graphic provided by: N/A. |
| |
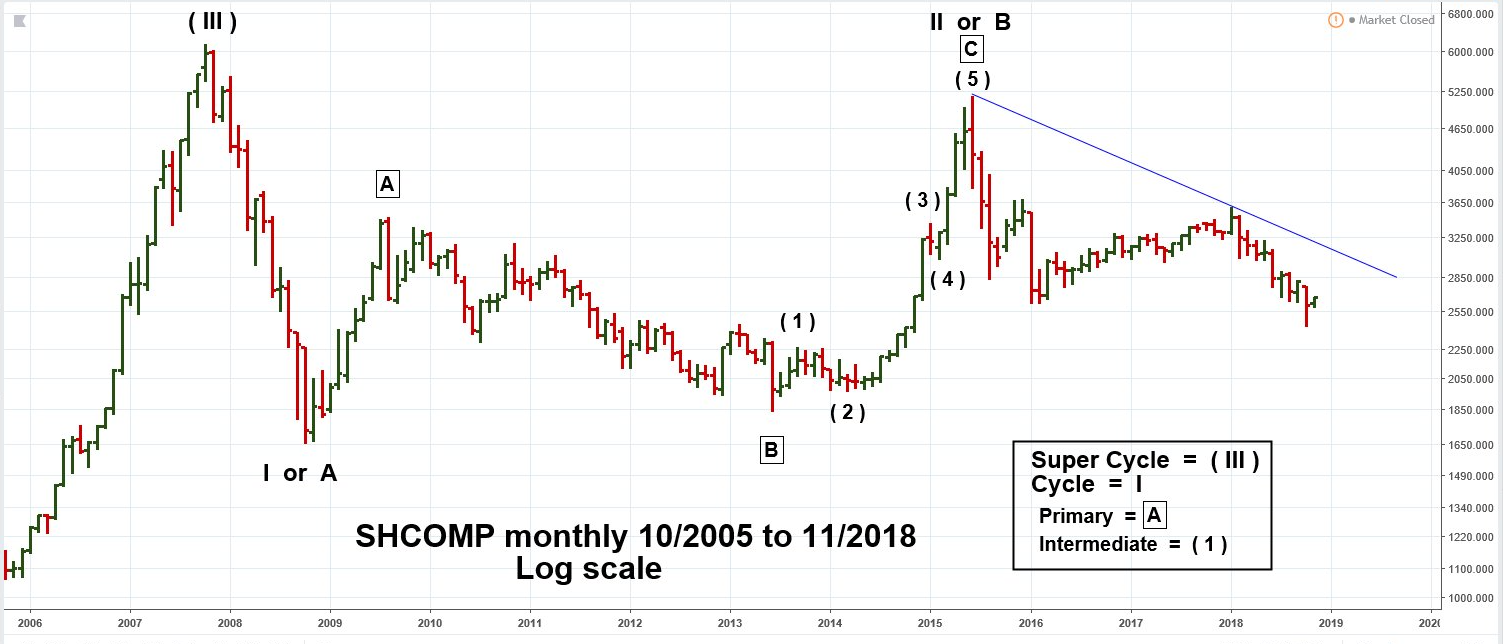
| Shanghai Composite - Monthly The monthly Shanghai Composite (SHCOMP) illustrated in Figure 3 shows an Elliott wave count of a potentially colossal bear market. For the sake of clarity on the chart I've labeled only the bearish count. Perhaps the SHCOMP 2007 to 2008 decline is not the first wave down of a developing larger bear market and the 2008 bottom is the start of a secular bull market? If SHCOMP started a bull market in 2008, then the interim peak in 2009 could be the first wave "one" with the 2013 bottom as a wave "two". The subsequent rally into the 2015 top could be a possible second wave "one" with the 2018 low as the second wave "two" This sequence is referred to as a series of "ones" and "twos" up, and is very bullish implying a super bull market that could continue for several years. Huge bull or bear market, how can you decide? In late 2018 it's not a factor, near term there's plenty of evidence for SHCOMP possible direction. |
|
| Figure 3. The monthly Shanghai Composite shows an Elliott wave count of a potentially colossal bear market. |
| Graphic provided by: Tradingview.com. |
| |
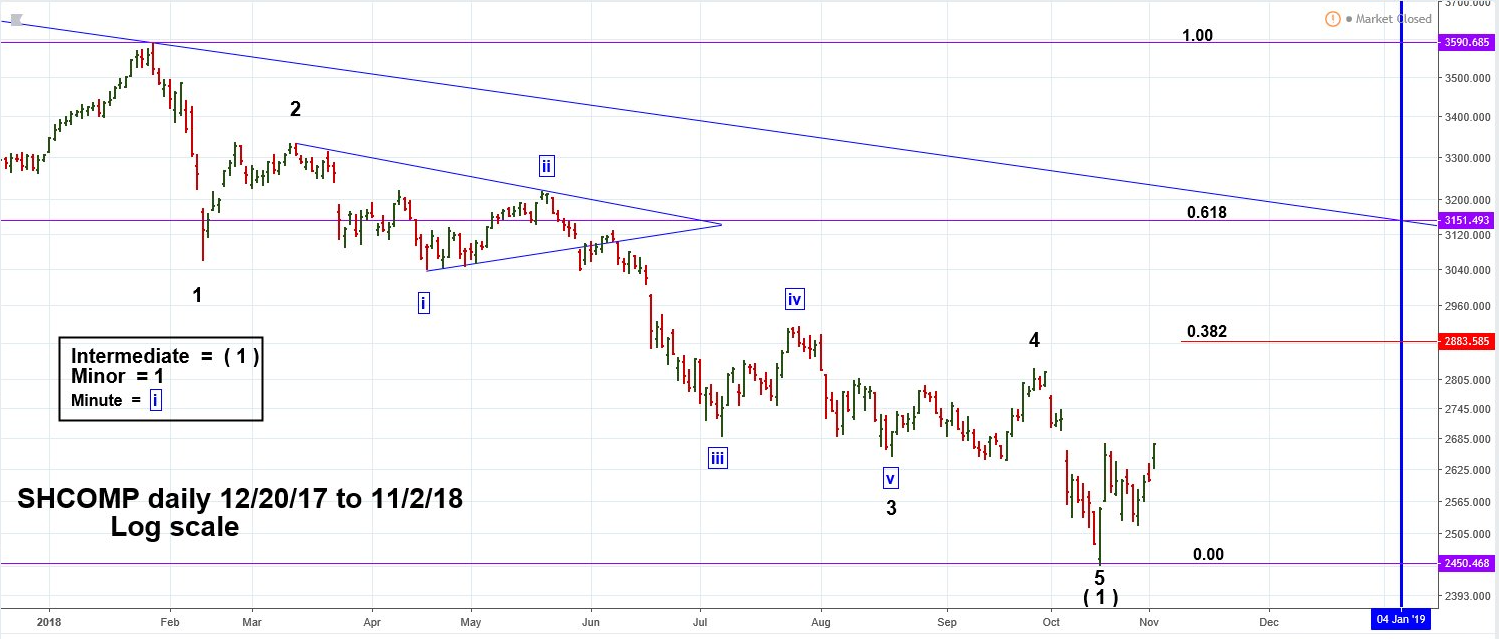
| Shanghai Composite - Daily One of the benefits of using Elliott wave analysis is that it teaches you to break markets into segments. In this case, examining the SHCOMP decline from the January 2018 top. Please see the daily SHCOMP chart illustrated in Figure 4. The 31.7% drop was a text book Elliott impulse wave, the pattern counts complete as of the low made on October 19, but we need more evidence that a significant bottom could be in place. That evidence comes from the Momentum dimension. The two-day rally that began on October 19 was 8.8% — the largest SHCOMP two-day rally in more than one year. Then on October 30 the subsequent retrace of this rally was about .666 — an outlier Fibonacci ratio 2/3. The third piece of evidence comes from SHCOMP performance relative to the SPX. The SHCOMP higher retracement bottom of October 30 was the same trading day in which the SPX made a new mini crash bottom at 2603.54. For almost all of 2018 SHCOMP was weaker relative to the SPX, then suddenly it's stronger — a solid bullish non-conformation. On November 2, SHCOMP reached a zone that covers July to September of heavy price overlap which represents resistance. If the rally can exceed this overlap zone and the 38.2% retracement, SCHOMP has a good chance to reach the 61.8% retracement level which is very close to the apex of the next price overlap zone. The long-term declining trend line from the 2015 peak crosses the resistance zone in early 2019 when the potential rally could end. |
|
| Figure 4. The 31.7% drop was a text book Elliott impulse wave. |
| Graphic provided by: Tradingview.com. |
| |
| Summary Elliott wave analysis is a fantastic tool to understanding the path markets take and mass psychology. Because Elliott wave theory is very effective in forecasting moves, traders are vulnerable to falling in love with a forecast. Always have evidence to back up a wave count, it could help reduce subjectivity and increase your chances of success. Further Reading: Frost A.J and Robert Prechter (1985) "Elliott Wave Principle", New Classics Library. |
Independent investment advisor, trader and writer. He has written articles for Technical Analysis of Stocks & Commodities, Traders.com Advantage,Futuresmag.com and, Finance Magnates. Author of website Four Dimension Trading.
| Website: | www.fourdimensiontrading.com |
| E-mail address: | markrivest@gmail.com |
Click here for more information about our publications!
Comments

Request Information From Our Sponsors
- StockCharts.com, Inc.
- Candle Patterns
- Candlestick Charting Explained
- Intermarket Technical Analysis
- John Murphy on Chart Analysis
- John Murphy's Chart Pattern Recognition
- John Murphy's Market Message
- MurphyExplainsMarketAnalysis-Intermarket Analysis
- MurphyExplainsMarketAnalysis-Visual Analysis
- StockCharts.com
- Technical Analysis of the Financial Markets
- The Visual Investor
- VectorVest, Inc.
- Executive Premier Workshop
- One-Day Options Course
- OptionsPro
- Retirement Income Workshop
- Sure-Fire Trading Systems (VectorVest, Inc.)
- Trading as a Business Workshop
- VectorVest 7 EOD
- VectorVest 7 RealTime/IntraDay
- VectorVest AutoTester
- VectorVest Educational Services
- VectorVest OnLine
- VectorVest Options Analyzer
- VectorVest ProGraphics v6.0
- VectorVest ProTrader 7
- VectorVest RealTime Derby Tool
- VectorVest Simulator
- VectorVest Variator
- VectorVest Watchdog