HOT TOPICS LIST
- MACD
- Fibonacci
- RSI
- Gann
- ADXR
- Stochastics
- Volume
- Triangles
- Futures
- Cycles
- Volatility
- ZIGZAG
- MESA
- Retracement
- Aroon
INDICATORS LIST
LIST OF TOPICS
PRINT THIS ARTICLE
by Mark Rivest
See what factors could make November 2018 a bullish month.
Position: N/A
Mark Rivest
Independent investment advisor, trader and writer. He has written articles for Technical Analysis of Stocks & Commodities, Traders.com Advantage,Futuresmag.com and, Finance Magnates. Author of website Four Dimension Trading.
PRINT THIS ARTICLE
SEASONAL TRADING
Stock Market Seasonal Patterns
11/01/18 04:03:27 PMby Mark Rivest
See what factors could make November 2018 a bullish month.
Position: N/A
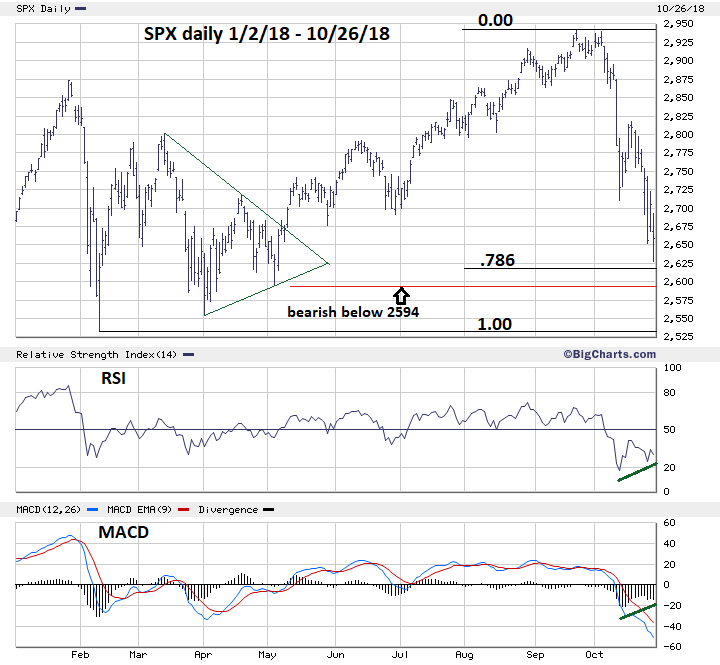
| October is notorious for sharp stock declines and October 2018 is a classic example. The S&P 500 (SPX) had declined 10% in less than one month and as of October 26, many think it could fall much further. Evidence from all four market dimensions — Price, Time, Momentum, and Sentiment — indicate strongly that November 2018 could be a bullish month. S&P 500 - Price Dimension Most of the time significant market turns occur with evidence from all four market dimensions. Most of the time does not mean all the time. As the SPX rallied into its late September peak it was well below important round number resistance of 3000 and significant Fibonacci resistance at 3050, which I've noted in several articles. Additionally, the Elliott wave pattern from both the February and early May bottoms implied the rally was incomplete. These bullish factors caused me to misjudge the size of the October decline. The situation going into November has bullish signals from all four market dimensions. Please see the SPX daily chart illustrated in Figure 1. The Elliott wave count shown in my October 17 article "The Stock Market Crash Ratio" remains valid. This count has SPX September to October decline as a potential Intermediate degree wave (2) of a possible developing Ending Diagonal Triangle. This count would be eliminated if the SPX broke below 2594.62. On October 26 the SPX reached the apex of the Elliott wave Horizonal Triangle which formed between February and May. Note the extensive price overlap as the apex formed. This represents potentially strong support. The SPX is also nearing the Fibonacci level of .786 which occasionally can predict support/resistance. Fibonacci .786 is the square root of the golden ratio .618 and is best used in conjunction with another support level. In this case the triangle apex. A fascinating aspect of the October free fall is that as of the close on October 26 it's smaller and taking longer than the February mini crash. During February the SPX fell 340 points in 10 trading days. From October 3 the SPX has declined only 317 points in 17 trading days. If the October decline is the start of a larger developing bear market, why would it be weaker than the February drop which was only a correction? |

|
| Figure 1. A fascinating aspect of the October free fall is that as of the close on October 26, it's smaller and taking longer than the February mini crash. |
| Graphic provided by: BigCharts.com. |
| |
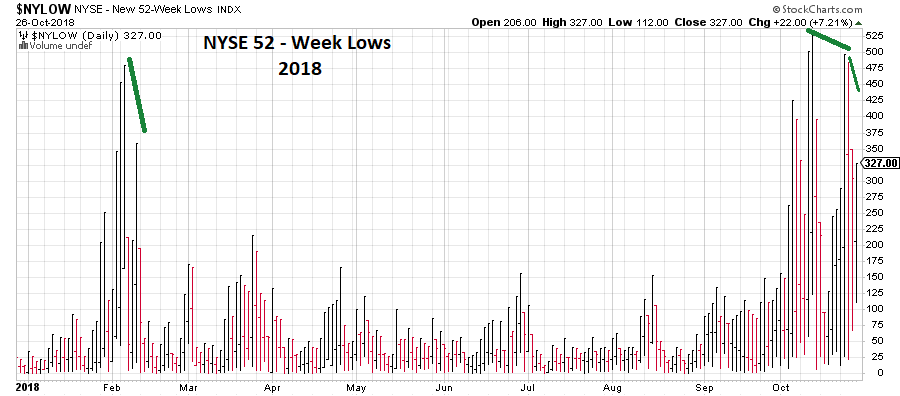
| Momentum Dimension The SPX chart also shows the daily RSI with a double bullish divergence. The daily MACD Histogram also has a bullish divergence, although the MACD lines are bearish. These external momentum indicators are backed by what are referred to as internal indicators. Please see the NYSE - New 52-Week Low chart illustrated in Figure 2. W hen the February decline ended on February 9 it had a bullish divergence, with less new 52-week lows than were recorded at the February 6 bottom. In late October there's a double bullish divergence. October 11 recorded 526 new lows, October 24 484 new lows, and on October 26 327 new lows. If there's a developing super crash, why are less stocks making new lows as the stock indices go lower? One interesting note about the NYSE Composite (NYA), which as of October 26 is the only US stock index to decisively break its February bottom. The .382 Fibonacci retracement of the entire NYA 2016 to 2018 bull move is at NYA 11841.99. The NYA low on October 26 was 11847.79, only 5.80 points away from a bulls-eye hit of potentially very important Fibonacci support. |

|
| Figure 2. If there’s a developing super crash, why are less stocks making new lows as the stock indices go lower? |
| Graphic provided by: StockCharts.com. |
| |
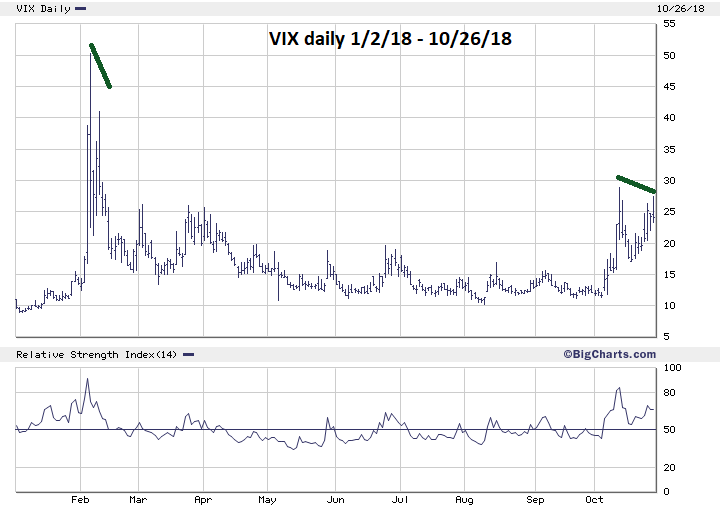
| Sentiment Dimension Please see the daily VIX chart illustrated in Figure 3. On October 11 the VIX reached its highest level of the free fall at 28.80. On October 26 the VIX hit 27.50, with the SPX at a lower price than on October 11. This indicates a lessening of fear. It could be a signal of rising stock prices like the last divergence during the February stock drop. If, however, the VIX were to exceed 28.80 it could mean the panic is growing and stock prices could decline much further. |

|
| Figure 3. On October 11 the VIX reached its highest level of the free fall at 28.80. |
| Graphic provided by: BigCharts.com. |
| |
| Time Dimension October is so infamous for sharp stock market drops that even people that don't know much about investing are aware of their occurrences. Yet, October does not have the strongest seasonal pattern — that honor goes to November. This can be proved by statistical analysis. Of the last 20 Novembers, 14 have closed the month up. Of the 6 down months only 3 where down significantly: One in 2000, the first year of a multi-year decline; November 2007 was at the beginning of a vicious 17-month bear market; and November 2008 was just after the worst part of that same bear market which still had several months of decline ahead. The other 3 bearish Novembers were only down marginally. November 2010 was down .004, November 2011 down .003, and November 2015 was down an insignificant .0001. November 2010 and 2011 were both followed by multi-month rallies. November 2015 was followed by a multi-week decline that finished the 2015 to 2016 correction. Adding November 2015 to the other 3 significant bearish Novembers means there were only 4 out of 20 Novembers that led to significant declines, that's only a 20% probability. |
| Summary November usually doesn't have spectacular rallies as most just have average rises, but November is reliable, with an 80% chance it could be a bullish month. Evidence from the dimensions of Price, Momentum, and Sentiment in late October add to the chances that November 2018 could be a bullish month. If the SPX can hold above 2594.62 it is probably in the third wave of an Ending Diagonal Triangle. The termination level for this Ending Diagonal Triangle could be SPX 3050. Time forecast for a possible significant top — January to February 2019. Further Reading: Frost A.J and Robert Prechter (1985) "Elliott Wave Principle", New Classics Library. |
Independent investment advisor, trader and writer. He has written articles for Technical Analysis of Stocks & Commodities, Traders.com Advantage,Futuresmag.com and, Finance Magnates. Author of website Four Dimension Trading.
| Website: | www.fourdimensiontrading.com |
| E-mail address: | markrivest@gmail.com |
Click here for more information about our publications!
PRINT THIS ARTICLE

Request Information From Our Sponsors
- StockCharts.com, Inc.
- Candle Patterns
- Candlestick Charting Explained
- Intermarket Technical Analysis
- John Murphy on Chart Analysis
- John Murphy's Chart Pattern Recognition
- John Murphy's Market Message
- MurphyExplainsMarketAnalysis-Intermarket Analysis
- MurphyExplainsMarketAnalysis-Visual Analysis
- StockCharts.com
- Technical Analysis of the Financial Markets
- The Visual Investor
- VectorVest, Inc.
- Executive Premier Workshop
- One-Day Options Course
- OptionsPro
- Retirement Income Workshop
- Sure-Fire Trading Systems (VectorVest, Inc.)
- Trading as a Business Workshop
- VectorVest 7 EOD
- VectorVest 7 RealTime/IntraDay
- VectorVest AutoTester
- VectorVest Educational Services
- VectorVest OnLine
- VectorVest Options Analyzer
- VectorVest ProGraphics v6.0
- VectorVest ProTrader 7
- VectorVest RealTime Derby Tool
- VectorVest Simulator
- VectorVest Variator
- VectorVest Watchdog
