HOT TOPICS LIST
- MACD
- Fibonacci
- RSI
- Gann
- ADXR
- Stochastics
- Volume
- Triangles
- Futures
- Cycles
- Volatility
- ZIGZAG
- MESA
- Retracement
- Aroon
INDICATORS LIST
LIST OF TOPICS
PRINT THIS ARTICLE
by Mark Rivest
Learn how to determine when a stock market crash could end.
Position: N/A
Mark Rivest
Independent investment advisor, trader and writer. He has written articles for Technical Analysis of Stocks & Commodities, Traders.com Advantage,Futuresmag.com and, Finance Magnates. Author of website Four Dimension Trading.
PRINT THIS ARTICLE
MOMENTUM
The Stock Market Crash Ratio
10/17/18 04:42:47 PMby Mark Rivest
Learn how to determine when a stock market crash could end.
Position: N/A
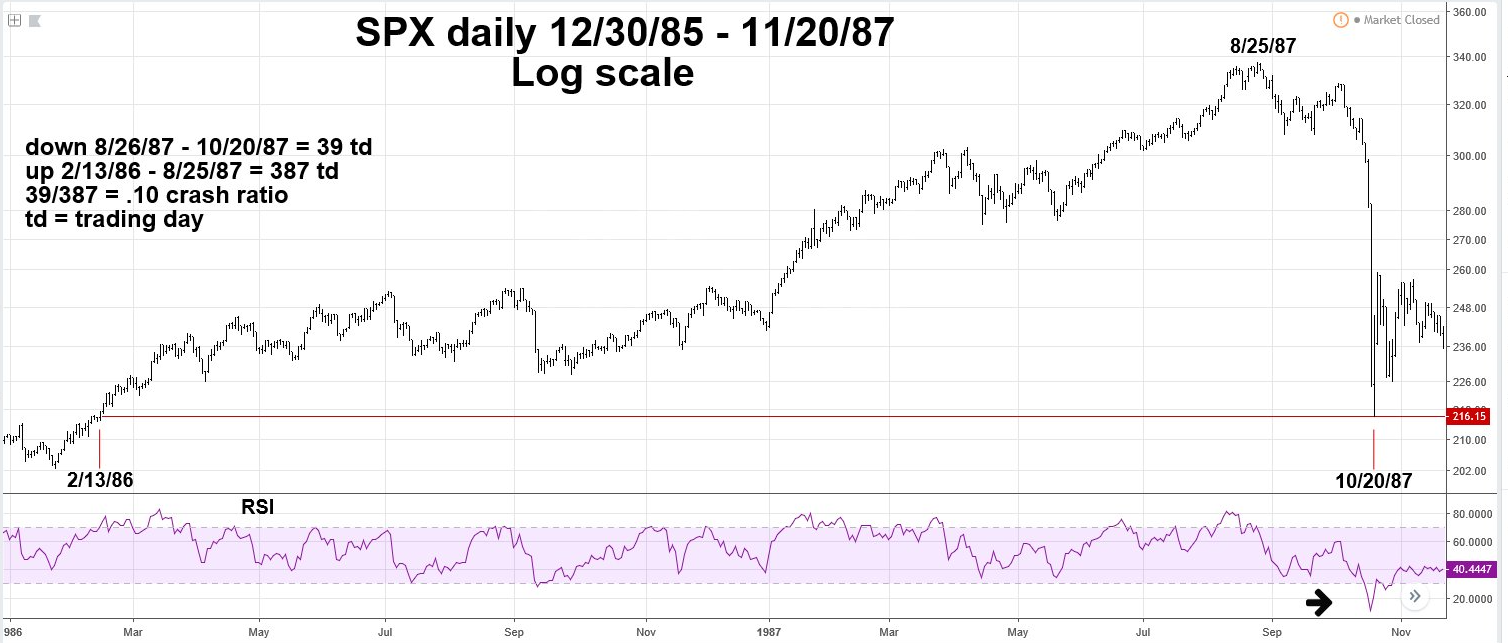
| Market crash is a widely used term to describe a free fall decline in the stock market. Crashes occur in all markets and time frames, although crash implies a gigantic stock market decline like the Dow Jones Industrial Average (DJIA) infamous October 1929 collapse. Examination of the stock market reveals that crashes can occur on a scale ranging from weekly to ten-minute charts. Regardless of size, the stock market crash ratio remains in a narrow zone. S&P 500 Daily 1986-1987 Christopher Carolan's book "The Spiral Calendar" illustrates five examples of stock market free fall drops with each decline getting progressively smaller. Starting with the October 1929 decline using weekly bar charts and finishing with a one-day crash on January 9, 1991, measured on a ten-minute bar chart. Quoting from the book, "The free fall patterns are an example of fractals. Fractals are similar patterns that repeat in a variety of scales. Fractals appear naturally in living and non-living things." The free fall examples I'm illustrating all happen after a significant peak has been made. All examples came at an all-time high, although this is not necessary for all crashes, there are instances of crashes occurring within the body of a bull market. Please see the S&P 500 (SPX) daily chart 1986 to 1987 illustrated in Figure 1. To determine the stock market crash ratio, first count the number of price bars after the primary peak to the crash bottom. Next, find the most recent time the SPX traded at the crash low; this was February 13, 1986. Then measure the price bars to the primary peak. The SPX 1987 crash had 39 price bars (trading days). The prior rally was 387 trading days. The crash ratio for the 1987 SPX free fall was 39/387 = .10 | ||||||||||||||||||||||||

| ||||||||||||||||||||||||
| Figure 1. The crash ratio for the 1987 SPX free fall was 39/387 = .10. | ||||||||||||||||||||||||
| Graphic provided by: Tradingview.com. | ||||||||||||||||||||||||
| | ||||||||||||||||||||||||
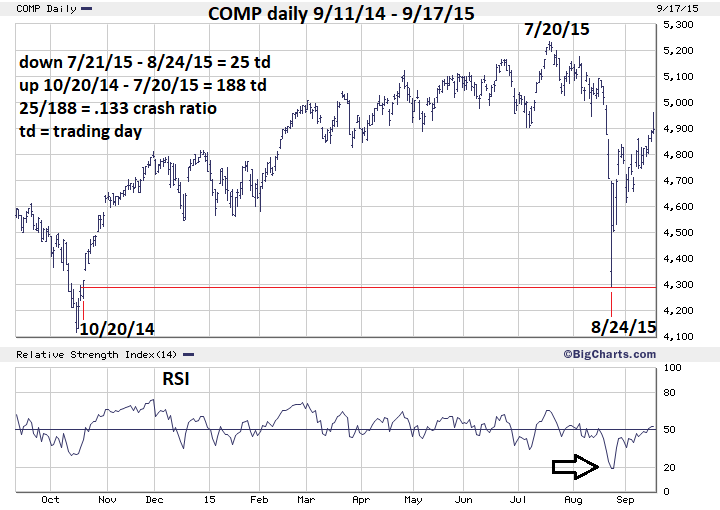
| Nasdaq Composite Daily 2014-2015 Frequently, when the three main US stocks indices are reaching an area of a potential top, each index will reach their respective bullish termination points at different times. In 2015 the DJIA and SPX topped in mid-May, while the Nasdaq Composite (COMP) reached its peak in July. In this situation the crash ratio is calculated from the last index to reach its summit. Please see the COMP daily chart 2014-2015 illustrated in Figure 2.The 2015 crash was 25 trading days preceded by a 188 trading day rally for a crash ratio of 25/188 = .133. | ||||||||||||||||||||||||

| ||||||||||||||||||||||||
| Figure 2. The 2015 crash was 25 trading days preceded by a 188 trading day rally for a crash ratio of 25/188 = .133. | ||||||||||||||||||||||||
| Graphic provided by: BigCharts.com. | ||||||||||||||||||||||||
| | ||||||||||||||||||||||||
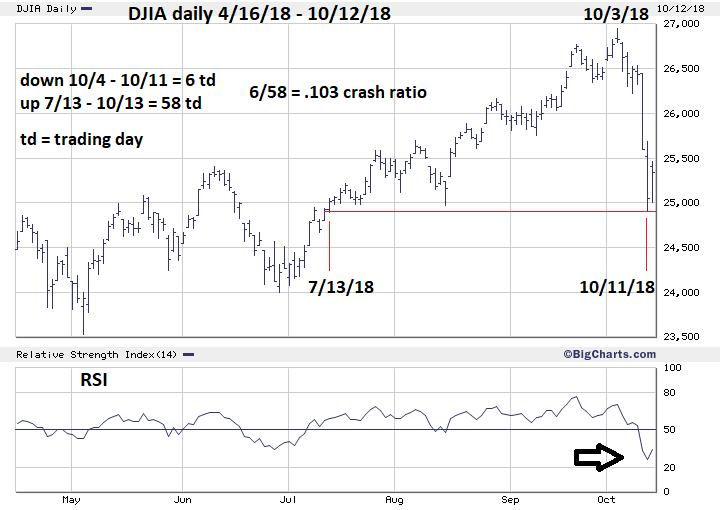
| Dow Jones Industrial Average Daily 2018 In the third quarter of 2018 each of the three main US stock indices were rallying into all-time highs. The COMP topped on August 30, followed by the SPX on September 21. The DJIA hit its high point on October 3 and is the index to measure the most recent free fall. The October 2018 crash probably came as a surprise to many market observers. The most significant clue came from the calendar, because October is notorious for rapid stock market declines. Please see the DJIA daily chart 2018 illustrated in Figure 3. As of the close on October 12, DJIA crash ratio is .103 which is in the zone for a completed crash. However, the COMP 2015 crash ratio was .133, so there's still time for the DJIA to keep falling. This could be very significant in terms of price because many times the biggest part of free fall comes on the last day. This article is being written on Sunday, October 14. It's possible the DJIA crash could climax on October 15 or 16. | ||||||||||||||||||||||||

| ||||||||||||||||||||||||
| Figure 3. As of the close on October 12 DJIA crash ratio is .103 which is in the zone for a completed crash. | ||||||||||||||||||||||||
| Graphic provided by: BigCharts.com. | ||||||||||||||||||||||||
| | ||||||||||||||||||||||||
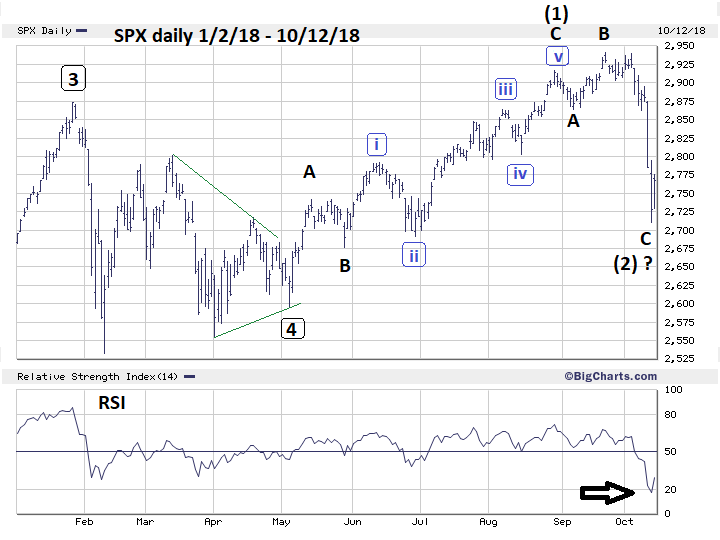
| S&P 500 - Elliott Wave Count For many weeks there have been several different alternate Elliott wave counts making it difficult to determine a prime count. The recent crash as of October 12 has cleared up the situation. Please see the SPX daily chart 2018 illustrated in Figure 4. An important clue was made on the final short-term rally that began on September 7 and terminated at the all-time high at SPX 2940 on September 21. The intra-day wave count was very choppy and implied it could be wave "B" up of a developing Elliott wave Expanding Flat. The decline into the October 11 bottom looks like a five-wave structure, which is how Expanding Flats terminate. If completed, the Expand Flat is probably wave (2) of a developing Ending Diagonal Triangle (EDT) that began at the May 3 bottom of 2594.62. Wave "twos" in EDT's are usually steep and retrace more than .618 of the preceding wave "one". At the October 11 bottom the supposed wave (2) had retraced .665 of wave (1). Also .665 is an outlier Fibonacci ratio 2/3. If the SPX is in an EDT, my forecast for the SPX bull market to terminate near 3050 is still valid. Time forecast for a possible significant top is January to February 2019. More about this in a future post. The developing EDT wave count would be invalidated if the SPX broke below 2594.62. | ||||||||||||||||||||||||

| ||||||||||||||||||||||||
| Figure 4. Time forecast for a possible significant top is January to February 2019. | ||||||||||||||||||||||||
| Graphic provided by: BigCharts.com. | ||||||||||||||||||||||||
| | ||||||||||||||||||||||||
| Study Of Five Stock Market Crashes This is the data from five stock market crashes over a period of eighty-nine years.
The crash ratio proves the fractal nature of the stock market. Regardless of size of the decline the ratio stays in a narrow range of .100 to .133. The recent October 2018 drop is a good test of the validity of using the crash ratio to time the termination of a crash. As of October 11, the DJIA, based on the ratio, may have already bottomed. If not it could reach its nadir in the next two trading days. My next article will follow up with more data about stock market crashes and the post-free fall environment. Further Reading: Carolan Christopher (1992) "The Spiral Calendar" New Classics Library. Frost A.J and Robert Prechter (1985) "Elliott Wave Principle", New Classics Library. |
Independent investment advisor, trader and writer. He has written articles for Technical Analysis of Stocks & Commodities, Traders.com Advantage,Futuresmag.com and, Finance Magnates. Author of website Four Dimension Trading.
| Website: | www.fourdimensiontrading.com |
| E-mail address: | markrivest@gmail.com |
Click here for more information about our publications!
Comments
Date: 10/21/18Rank: 5Comment:

Request Information From Our Sponsors
- StockCharts.com, Inc.
- Candle Patterns
- Candlestick Charting Explained
- Intermarket Technical Analysis
- John Murphy on Chart Analysis
- John Murphy's Chart Pattern Recognition
- John Murphy's Market Message
- MurphyExplainsMarketAnalysis-Intermarket Analysis
- MurphyExplainsMarketAnalysis-Visual Analysis
- StockCharts.com
- Technical Analysis of the Financial Markets
- The Visual Investor
- VectorVest, Inc.
- Executive Premier Workshop
- One-Day Options Course
- OptionsPro
- Retirement Income Workshop
- Sure-Fire Trading Systems (VectorVest, Inc.)
- Trading as a Business Workshop
- VectorVest 7 EOD
- VectorVest 7 RealTime/IntraDay
- VectorVest AutoTester
- VectorVest Educational Services
- VectorVest OnLine
- VectorVest Options Analyzer
- VectorVest ProGraphics v6.0
- VectorVest ProTrader 7
- VectorVest RealTime Derby Tool
- VectorVest Simulator
- VectorVest Variator
- VectorVest Watchdog
