

HOT TOPICS LIST
- MACD
- Fibonacci
- RSI
- Gann
- ADXR
- Stochastics
- Volume
- Triangles
- Futures
- Cycles
- Volatility
- ZIGZAG
- MESA
- Retracement
- Aroon
INDICATORS LIST
LIST OF TOPICS
PRINT THIS ARTICLE
by Mark Rivest
See where important resistance could be for the S&P 500 and FTSE 100.
Position: N/A
Mark Rivest
Independent investment advisor, trader and writer. He has written articles for Technical Analysis of Stocks & Commodities, Traders.com Advantage,Futuresmag.com and, Finance Magnates. Author of website Four Dimension Trading.
PRINT THIS ARTICLE
FIBONACCI
How High is UP? - Part Two
10/10/18 04:40:42 PMby Mark Rivest
See where important resistance could be for the S&P 500 and FTSE 100.
Position: N/A
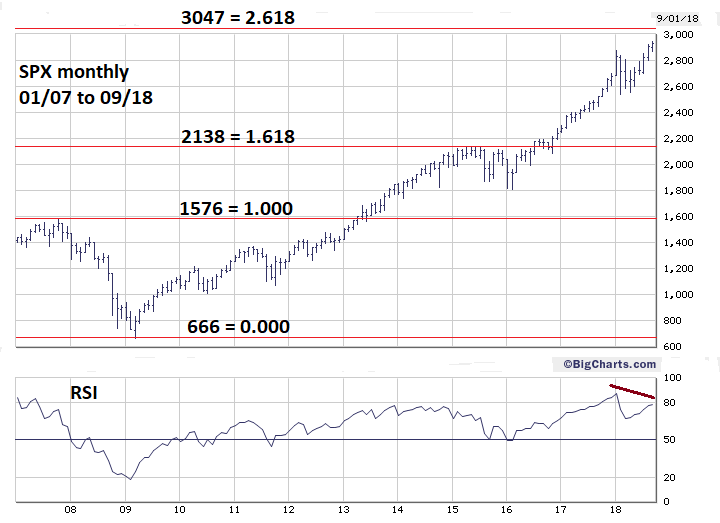
| Fibonacci retracements and extensions can be very effective in discovering market turning points. Trend lines connecting the termination points of rallies and declines are also very useful in timing markets. On the eve of the fourth quarter 2018, the S&P 500 (SPX) is nearing what could be very significant Fibonacci resistance. Simultaneously, the FTSE 100 (UKX) is rallying towards an important rising trend line. S&P 500 - Long Term My June 8, 2015 article "The Golden Section" noted that on May 20, 2015 the SPX hit 2134 which was very close to 2138, a very important Fibonacci resistance point. This resistance point was calculated by multiplying the SPX 2007 to 2009 decline of 909.30 points by 1.618 = 1471.24 and adding it to the 2009 SPX bottom of 666.79 which targets 2138.03. This proved to be an intermediate top, SPX 2134 was the start of a 15% decline that lasted eight months. My February 1, 2018 article "How High is Up?" noted the next significant Fibonacci resistance was at SPX 3047. This is calculated by again taking the 909.30 of the 2007 to 2009 decline and multiplied by 2.618 which is 2380.54 + 666.79 = 3047.33. Please see the SPX monthly chart in Figure 1. On September 21 the SPX hit a high of 2940. Markets tend to gravitate towards round numbers, the SPX is now tantalizingly close to the big 3000. If the SPX can reach 3000 it will then be within leeway of the bull's eye 3047 target. It's rare for a market to have an exact hit on a Fibonacci point. Considering these coordinates cover a period of several years and a large percentage gain, a leeway of plus or minus fifty SPX points is appropriate. Also, note that the SPX now has a bearish divergence on the monthly RSI indicator. My January 15, 2018 article "RSI - The Super Indicator" noted that extreme RSI readings above 70% in the stock market usually indicate a short-term peak. Significant tops almost always have at least one bearish RSI divergence. As of September 21, the SPX monthly, weekly and daily RSI all have bearish divergences with the January 2018 top. If these divergences hold the SPX is vulnerable to at least an intermediate degree correction that could last for several months. |
|
| Figure 1. The SPX is now tantalizingly close to the big 3000. |
| Graphic provided by: BigCharts.com. |
| |
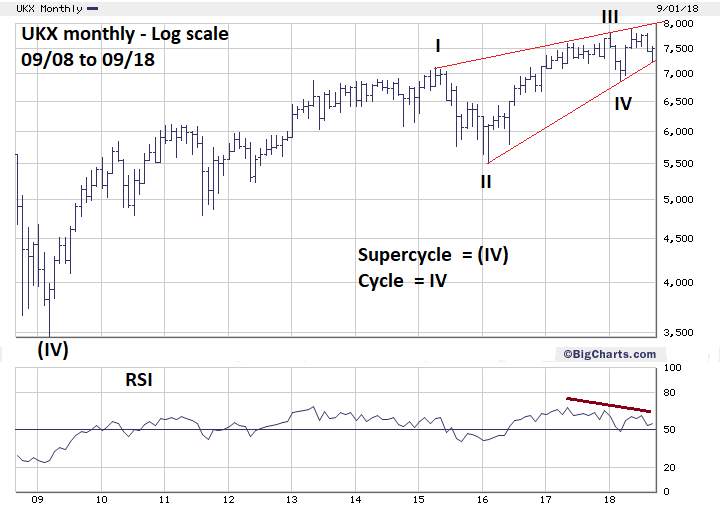
| FTSE 100 - Long Term The FTSE 100 (UKX) has formed a bearish wedge that began at the 2015 top and could be a developing Elliott wave Ending Diagonal Triangle (EDT). They appear at the ending phase of larger patterns. Please see the monthly UKX chart illustrated in Figure 2. Typically, an EDT in a bull market will climax with a brief throw over of the upper trend line. In this case that could take the UKX just above 8000. If the UKX fails to break above its high of 7903 made in May and moves below the lower trend line it would imply an important top is already in place. |
|
| Figure 2. The FTSE 100 (UKX) has formed a bearish wedge that began at the 2015 top. |
| Graphic provided by: BigCharts.com. |
| |
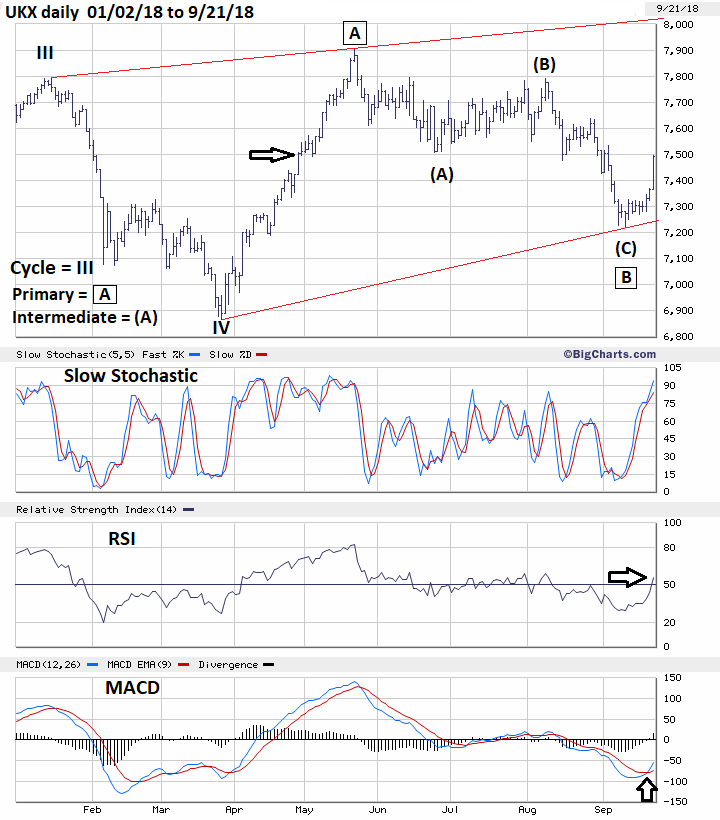
| FTSE 100 - Short Term There's a considerable amount of evidence from the momentum dimension that suggests the UKX could reach 8000 in a few weeks. Please see the daily UKX chart illustrated in Figure 3. At first glance the Slow Stochastic is implying the UKX could be overbought. However, Stochastic indicators are usually the most sensitive to price changes. Note that in April, Stochastic reached the overbought zone and the UKX continued to rally. The RSI has just moved above 50% and implies the UKX could have a lot more room to run on the upside before RSI reaches 70% — the start of the overbought zone. The most bullish signal comes from the MACD. This indicator is still in the oversold zone and just had a bullish crossover signal. This combination implies there's a lot of momentum fuel to power the UKX higher. It may also be possible to determine when the rally could end. On September 21 UKX high was 7495. On April 27 UKX hit a high at 7507 and subsequently rallied another 25 calendars days, topping at 7903 on May 22. Adding 25 calendar days to September 21 targets October 16th as a possible UKX top. |
|
| Figure 3. The most bullish signal comes from the MACD. |
| Graphic provided by: BigCharts.com. |
| |
| Summary If the UKX does rally into mid-October, this is approximately the amount of time the SPX could need to reach 3000 to 3050. For the next several weeks both the SPX and UKX should to be followed. If both indices reach their respective upside targets in mid-October it could be the most significant peak since the SPX top made in May 2015. Further Reading: Frost A.J and Robert Prechter (1985) "Elliott Wave Principle", New Classics Library. |
Independent investment advisor, trader and writer. He has written articles for Technical Analysis of Stocks & Commodities, Traders.com Advantage,Futuresmag.com and, Finance Magnates. Author of website Four Dimension Trading.
| Website: | www.fourdimensiontrading.com |
| E-mail address: | markrivest@gmail.com |
Click here for more information about our publications!
Comments

Request Information From Our Sponsors
- StockCharts.com, Inc.
- Candle Patterns
- Candlestick Charting Explained
- Intermarket Technical Analysis
- John Murphy on Chart Analysis
- John Murphy's Chart Pattern Recognition
- John Murphy's Market Message
- MurphyExplainsMarketAnalysis-Intermarket Analysis
- MurphyExplainsMarketAnalysis-Visual Analysis
- StockCharts.com
- Technical Analysis of the Financial Markets
- The Visual Investor
- VectorVest, Inc.
- Executive Premier Workshop
- One-Day Options Course
- OptionsPro
- Retirement Income Workshop
- Sure-Fire Trading Systems (VectorVest, Inc.)
- Trading as a Business Workshop
- VectorVest 7 EOD
- VectorVest 7 RealTime/IntraDay
- VectorVest AutoTester
- VectorVest Educational Services
- VectorVest OnLine
- VectorVest Options Analyzer
- VectorVest ProGraphics v6.0
- VectorVest ProTrader 7
- VectorVest RealTime Derby Tool
- VectorVest Simulator
- VectorVest Variator
- VectorVest Watchdog