

HOT TOPICS LIST
- MACD
- Fibonacci
- RSI
- Gann
- ADXR
- Stochastics
- Volume
- Triangles
- Futures
- Cycles
- Volatility
- ZIGZAG
- MESA
- Retracement
- Aroon
INDICATORS LIST
LIST OF TOPICS
PRINT THIS ARTICLE
by Mark Rivest
Time cycles and momentum hint the bull market could be nearing an end.
Position: N/A
Mark Rivest
Independent investment advisor, trader and writer. He has written articles for Technical Analysis of Stocks & Commodities, Traders.com Advantage,Futuresmag.com and, Finance Magnates. Author of website Four Dimension Trading.
PRINT THIS ARTICLE
ELLIOTT WAVE
End Game for the Stock Market?
08/23/18 04:28:41 PMby Mark Rivest
Time cycles and momentum hint the bull market could be nearing an end.
Position: N/A
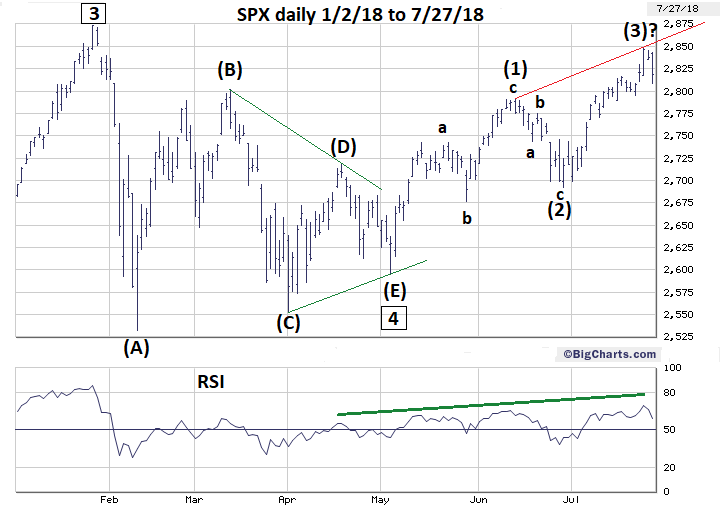
| Since March of 2009 the S&P 500 (SPX) has been in a bull market interrupted only once by a multi-month decline of 20%. The last time the SPX had a bull market that endured this long, with only one intermediate degree correction, was from 1990 to 2000. The subsequent bear market lasted nearly three years and fell by more than 50%. Elliott Wave Analysis Stock markets reflect a mass human mind and their direction can be tracked using Elliott wave patterns. The mass mind, like an individual, can change. When using Elliott wave analysis there are always alternate paths a market can take. Since the SPX January 2018 peak all subsequent rally highs could be secondary tops of a much larger developing bearish move. There are several paths for the SPX to make a new all-time high. My May 24 article "Global Bullish Confirmation" noted that an Elliott wave Horizontal Triangle could have been completed at the SPX May 3 bottom of 2594. Usually after completion of a Horizontal Triangle markets have a powerful thrust in the direction of the primary trend, in this case up. The daily SPX chart in Figure 1 illustrates that the rally after May 3 has been slow and choppy. Instead of a thrust, the SPX could be forming an Elliott wave Ending Diagonal Triangle (EDT). An EDT takes a wedge shape within two converging lines and is the termination point of larger patterns. The pattern occurs mostly in the fifth wave position with each sub wave including waves 1, 3, and 5, subdividing into a three-wave structure. Often the EDT fifth wave ends with a throw-over of the trendline connecting the end points of waves one and three. The fourth wave almost always overlaps the price territory of wave one. After the May 3 bottom, the supposed EDT wave (1) took the shape of a clear three wave pattern. The supposed wave (3) does not have a clear three-wave shape but is shorter in both price and time to wave (1), which almost always happens in an EDT. If wave (4) down is under construction, it will need to reach at least SPX 2791.41 — the top of wave (1). The supposed wave (2) lasted about ten trading days, wave (4) should be shorter in time than wave (2). As of July 27, there have been two trading day since the wave (3) peak. If wave (4) is in effect it could end in two to four trading days after July 27. |
|
| Figure 1. Stock markets reflect a mass human mind and its direction can be tracked using Elliott wave patterns. |
| Graphic provided by: BigCharts.com. |
| |
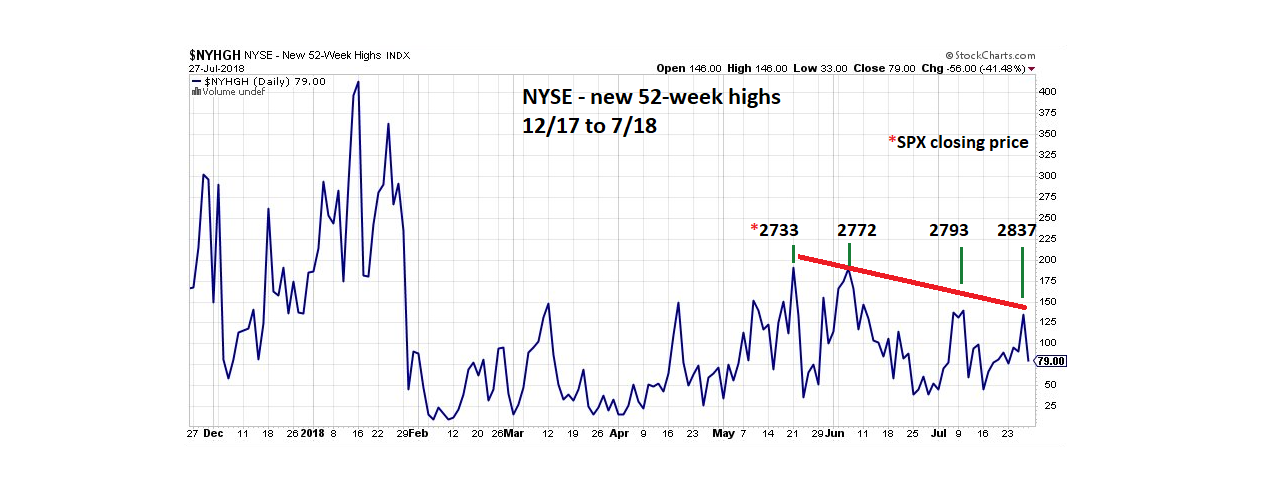
| Momentum Analysis The best evidence that the SPX could be forming an EDT comes from the momentum dimension. Please see the NYSE-new 52-week highs chart illustrated in Figure 2. Since the May 21 top the SPX has moved higher while the number of new 52-week highs has diminished — a bearish divergence. Additionally, there was a double top formed by the March 13 top at 2801 and the June 13 peak at 2791. Normally, a breach of this type of resistance would trigger a vigorous rally. So far, the move above 2801 has been anemic and the sell off on July 27 came within seven points of the prior barrier. On the bullish side of the coin, the highest daily RSI reading since the February 9 bottom came on July 25 at SPX 2846. If this was the termination point for the SPX rally off the February bottom there probably would have been at least one bearish RSI divergence. A rising daily RSI and SPX implies the rally could continue. On July 27 the Nasdaq Composite declined 1.46%, the Dow Jones Industrial Average (DJIA) declined only .30%. The Financial sector ETF XLF was up .21% and the Consumer Staples sector ETF XLP was up .13%. If July 27 was the start of a much larger decline you would expect all sectors to be down and a bigger decline for the DJIA. To sum up the momentum evidence, the rally from the February bottom is weakening but could continue for a few more weeks. |
|
| Figure 2. Since the May 21 top the SPX has moved higher while the number of new 52�week highs has diminished — a bearish divergence. |
| Graphic provided by: StockCharts.com. |
| |
| Conclusion My July 26 article "Stock Market Time Tunnel" noted that August 20, 2018 could be the bullseye target date for a major stock top. The supposed wave (3) of the EDT was about eighteen trading days, the yet to form wave (5) should be shorter in time than wave (3). If an EDT pattern is under construction it could complete sometime near August 20, 2018. My February 1 article "How High is Up?" noted major SPX Fibonacci resistance at 3047. If an EDT pattern is forming it will probably top somewhere in the low 2900s, more about this in a future article if necessary. We could know in just a few weeks if either of these levels is important resistance. Because of their complexity, Ending Diagonal Triangles are incredibly accurate in catching market turns. If this current pattern does complete sometime in mid-August 2018 it could be one of the best profit opportunities of the year. Further Reading: Frost A.J and Robert Prechter (1985) "Elliott Wave Principle", New Classics Library. |
Independent investment advisor, trader and writer. He has written articles for Technical Analysis of Stocks & Commodities, Traders.com Advantage,Futuresmag.com and, Finance Magnates. Author of website Four Dimension Trading.
| Website: | www.fourdimensiontrading.com |
| E-mail address: | markrivest@gmail.com |
Click here for more information about our publications!
Comments
Date:�10/11/18Rank:�5Comment:�great article /

Request Information From Our Sponsors
- StockCharts.com, Inc.
- Candle Patterns
- Candlestick Charting Explained
- Intermarket Technical Analysis
- John Murphy on Chart Analysis
- John Murphy's Chart Pattern Recognition
- John Murphy's Market Message
- MurphyExplainsMarketAnalysis-Intermarket Analysis
- MurphyExplainsMarketAnalysis-Visual Analysis
- StockCharts.com
- Technical Analysis of the Financial Markets
- The Visual Investor
- VectorVest, Inc.
- Executive Premier Workshop
- One-Day Options Course
- OptionsPro
- Retirement Income Workshop
- Sure-Fire Trading Systems (VectorVest, Inc.)
- Trading as a Business Workshop
- VectorVest 7 EOD
- VectorVest 7 RealTime/IntraDay
- VectorVest AutoTester
- VectorVest Educational Services
- VectorVest OnLine
- VectorVest Options Analyzer
- VectorVest ProGraphics v6.0
- VectorVest ProTrader 7
- VectorVest RealTime Derby Tool
- VectorVest Simulator
- VectorVest Variator
- VectorVest Watchdog