

HOT TOPICS LIST
- MACD
- Fibonacci
- RSI
- Gann
- ADXR
- Stochastics
- Volume
- Triangles
- Futures
- Cycles
- Volatility
- ZIGZAG
- MESA
- Retracement
- Aroon
INDICATORS LIST
LIST OF TOPICS
PRINT THIS ARTICLE
by Mark Rivest
Technical analysis of stocks provides clues as to which nation could lose the least.
Position: N/A
Mark Rivest
Independent investment advisor, trader and writer. He has written articles for Technical Analysis of Stocks & Commodities, Traders.com Advantage,Futuresmag.com and, Finance Magnates. Author of website Four Dimension Trading.
PRINT THIS ARTICLE
MARKET TIMING
Trade War - USA Vs. China
07/12/18 04:15:58 PMby Mark Rivest
Technical analysis of stocks provides clues as to which nation could lose the least.
Position: N/A
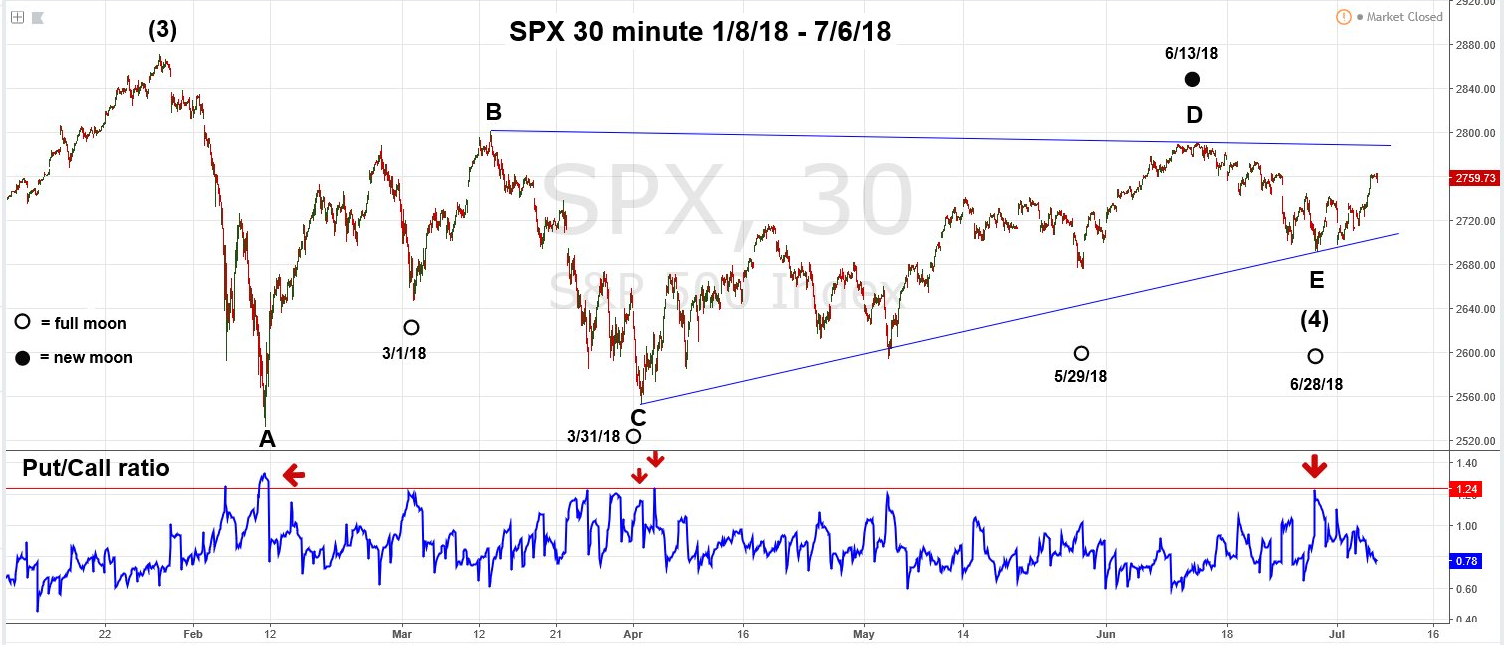
| In physical warfare there are no winners, one side just loses less than the other. The same is true in economic warfare. During a trade war no one wins, both sides suffer — one side will suffer less. With recent tariff increases, a trade war may have begun. An examination of US and Chinese major stock indices give clues to who could be the biggest loser. USA - S&P 500 In my February 15 article, "S&P 500 - Deadly Ground", I speculated the S&P 500 (SPX) could be forming an Elliott wave Horizontal Triangle. My May 24 article, "Global Bullish Confirmation", noted that the Horizontal Triangle may have completed on the SPX - May 3 bottom at 2594.62. It now appears the Horizontal Triangle could have continued forming into the June 28 bottom at SPX 2691.99. Please see the SPX 30-minute chart illustrated in Figure 1. The strongest evidence a Horizontal Triangle completed on June 28 is the CBOE total Put/Call ratio, reported every 30 minutes throughout the SPX trading day. In an ideal Horizontal Triangle that corrects the progress of a bull market, sentiment should get more bearish as the triangle contracts and price rises at the "c" and "e" bottoms. On June 28 the P/C ratio did not exceed the high recorded at the February 9 SPX bottom. But both wave "C" and "E" bottoms have readings that are in the same area. A classic sign of a market climbing a wall of worry. Also, there's been a return of the fascinating lunar cycle which typically occurs in sideways trending markets. For stocks, new moons usually signal tops while full moons signal bottoms. The June 28 SPX bottom coming on a full moon and a high P/C ratio is like the SPX April 2 bottom after a full moon on Saturday, March 31. This was the point of origin for a multi-week rally. |
|
| Figure 1. The strongest evidence a Horizontal Triangle completed on June 28 is the CBOE total Put/Call ratio. |
| Graphic provided by: Tradingview.com. |
| |
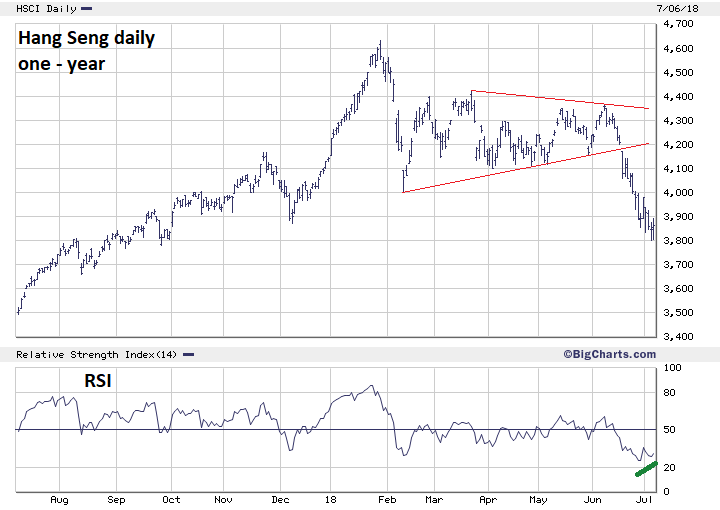
| China - Hang Seng Sometimes a simple straight line can be a powerful tool to determine a market's direction. On June 9 the Hang Seng (HSI) broke decisively below a rising trend line from the February 9 bottom. The selloff that day continued and took out an important secondary bottom made on April 4. Please see the daily HSI chart illustrated in Figure 2. My May 3 article, "Signals from the Hang Seng", speculated a breach of the April 4 bottom could lead to an attack of the very important bottom made on February 9. This is exactly what happened causing the HSI to decline even further. This sharp decline could have triggered a strong SPX drop, but it did not. From June 7 to July 5 the HSI declined 10.5% while the SPX is down only 1.2%. As of July 6, the HSI is 2.8% below its February 9 bottom and the SPX is 8.9% above its February 9 bottom. Short term, the daily RSI has a bullish divergence off an oversold reading, signaling a rally may have begun. |
|
| Figure 2. On June 9 the Hang Seng (HSI) broke decisively below a rising trend line from the February 9 bottom. |
| Graphic provided by: BigCharts.com. |
| |
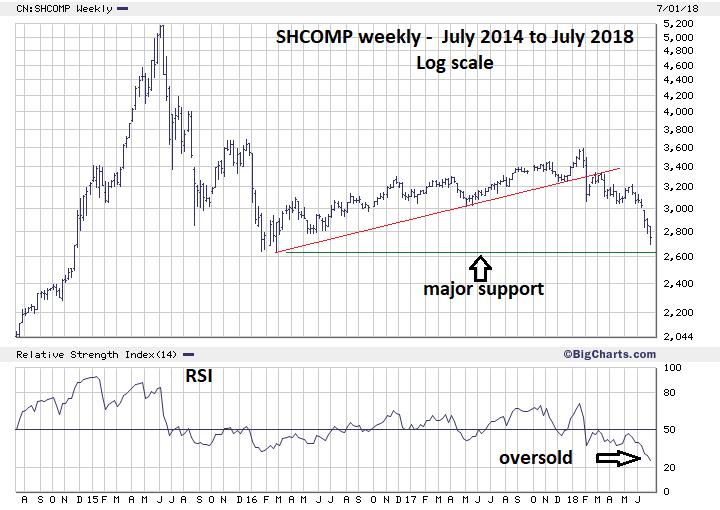
| China - Shanghai Composite The Shanghai Composite (SHCOMP) is the weakest of the major world stock indices. It made an all-time high of 6124 in October 2007. It then had a secondary top in June 2015 at 5178 followed by a 49% decline. The rally from early 2016 to 2018 was much weaker than its global counterparts and the new decline is now testing its early 2016 bottom. The weekly SHCOMP chart illustrated in Figure 3 shows again the significance of a trend line break. Note how this prior support line became resistance as the post break rally was held in check by the line. The recent low at 2691 is close to major support at 2638, the weekly RSI is in the oversold zone. These two factors indicate the SHCOMP could be poised for a multi-week rally. |
|
| Figure 3. The recent low at 2691 is close to major support at 2638, while the weekly RSI is in the oversold zone. |
| Graphic provided by: BigCharts.com. |
| |
| Conclusion Stock markets are the best economic forecasting tool. The performance of the SHCOMP indicates economic weakness in the Chinese economy since 2015, and predates the current tariff increases by several years. China will clearly be hurt more if the trade war continues. A break below the early 2016 bottom at 2638 could be very important, signaling much lower prices. Near term the SHCOMP, HSI, and SPX appear poised to rally. Major SPX resistance is at 3050 which could be reached in August or early September. Chinese stocks appear to be the leaders of what could be a global economic contraction. If this does happen, then a trade war would be like adding gasoline to a fire. Further Reading: Frost A.J and Robert Prechter (1985) "Elliott Wave Principle", New Classics Library. |
Independent investment advisor, trader and writer. He has written articles for Technical Analysis of Stocks & Commodities, Traders.com Advantage,Futuresmag.com and, Finance Magnates. Author of website Four Dimension Trading.
| Website: | www.fourdimensiontrading.com |
| E-mail address: | markrivest@gmail.com |
Click here for more information about our publications!
Comments

Request Information From Our Sponsors
- StockCharts.com, Inc.
- Candle Patterns
- Candlestick Charting Explained
- Intermarket Technical Analysis
- John Murphy on Chart Analysis
- John Murphy's Chart Pattern Recognition
- John Murphy's Market Message
- MurphyExplainsMarketAnalysis-Intermarket Analysis
- MurphyExplainsMarketAnalysis-Visual Analysis
- StockCharts.com
- Technical Analysis of the Financial Markets
- The Visual Investor
- VectorVest, Inc.
- Executive Premier Workshop
- One-Day Options Course
- OptionsPro
- Retirement Income Workshop
- Sure-Fire Trading Systems (VectorVest, Inc.)
- Trading as a Business Workshop
- VectorVest 7 EOD
- VectorVest 7 RealTime/IntraDay
- VectorVest AutoTester
- VectorVest Educational Services
- VectorVest OnLine
- VectorVest Options Analyzer
- VectorVest ProGraphics v6.0
- VectorVest ProTrader 7
- VectorVest RealTime Derby Tool
- VectorVest Simulator
- VectorVest Variator
- VectorVest Watchdog