

HOT TOPICS LIST
- MACD
- Fibonacci
- RSI
- Gann
- ADXR
- Stochastics
- Volume
- Triangles
- Futures
- Cycles
- Volatility
- ZIGZAG
- MESA
- Retracement
- Aroon
INDICATORS LIST
LIST OF TOPICS
PRINT THIS ARTICLE
by Mark Rivest
Additional evidence indicates Utility stocks are poised to rally.
Position: N/A
Mark Rivest
Independent investment advisor, trader and writer. He has written articles for Technical Analysis of Stocks & Commodities, Traders.com Advantage,Futuresmag.com and, Finance Magnates. Author of website Four Dimension Trading.
PRINT THIS ARTICLE
ELLIOTT WAVE
Utility Stock Bargains - Part Two
02/08/18 03:54:36 PMby Mark Rivest
Additional evidence indicates Utility stocks are poised to rally.
Position: N/A
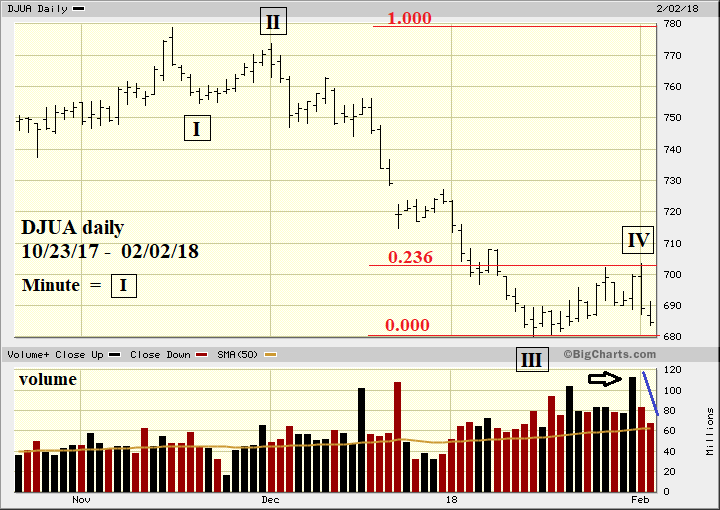
| The Dow Jones Utility Average (DJUA) appears to be building a base from its bottom on January 16, 2018. Since my January 25, 2018 article "Utility Stock Bargains" three additional pieces of evidence have appeared strengthening the case for a DJUA bottom. A very favorable risk/reward ratio could be in place for Utility stock/fund long positions Dow Jones Utility Average My January 25 article noted the Elliott wave count from the DJUA November 15 top was exceptionally clear. Please see the daily DJUA chart illustrated in Figure 1. Since the bottom made on January 16 the rally is about equal in both price and time as the supposed Minute wave "II"-boxed rally from November 20, 2017 - December 1, 2017. Equality between waves "two" and "four" is a common Fibonacci ratio within an Elliott five wave impulse pattern. Additionally, a .236 retrace of the entire decline from November 15 - January 16 is 703.32. The rally high on February 1 was 703.46, a near perfect hit of Fibonacci resistance. Volume on January 31 spiked up. On the subsequent declining days volume has decreased which indicates decreasing bearish power. Finally, there's usually an inverse relationship between interest rates and Utility stock prices. The reason for the large DJUA drop from November 15 - January 16 is related to the sharp rise — particularly in short term interest rates. Since the DJUA bottom on January 16 interest rates have continued to rise, yet the DJUA has not made new lows. This is the relationship between the DJUA and the five-year treasury yield (FVX), ten-year treasury yield (TNX) and thirty-year treasury yield (TYX). For this article consider yield and rate to be synonymous. DJUA FVX TNX TYX 1/16/18 680.01 2.37 2.56 2.86 2/02/18 683.59 2.62 2.85 3.10 Despite an increase in rates from the short to long end of the yield curve, the DJUA low on 2/02/18 was still higher than on 1/16/18. This is another sign the Utility stock bears are losing power and perhaps a forecast that rates could be due to decline. One interesting side note; the FVX rally from the September 7 bottom at 1.62 has increased as of February 2 61.7%, nearly the golden Fibonacci ratio of .618. |
|
| Figure 1. Volume on January 31 spiked up. On the subsequent declining days volume has decreased, which indicates decreasing bearish power. |
| Graphic provided by: BigCharts.com. |
| |
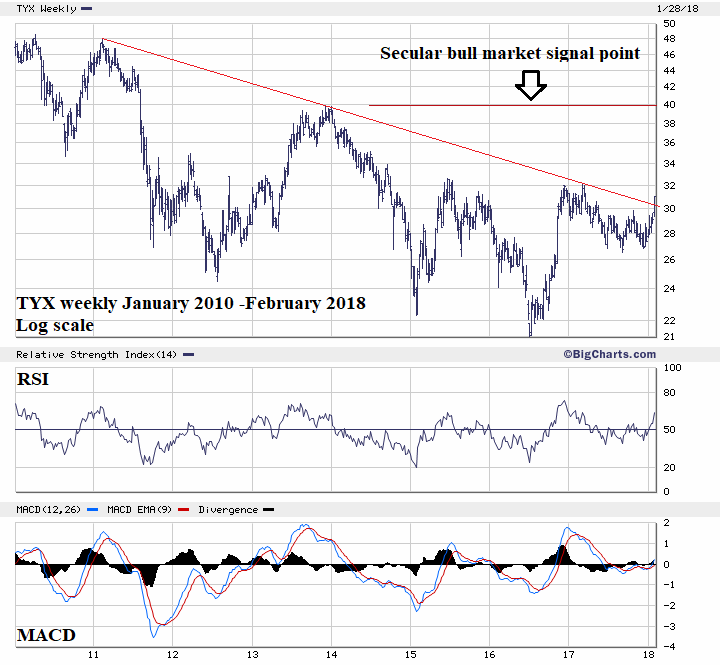
| Thirty-Year Treasury Yield Regardless of what may happen to interest rates in the short-term, long-term interest rates represented by TYX, gave a very important signal that rates could continue to climb. Please see the weekly TYX chart illustrated in Figure 2. TYX has broken above the multi-year declining trend line that began in early 2011. This opens the door for what could be an even more powerful signal, a break above TYX 3.25. Please see my January 18, 2017 article "The Prospect for Higher Interest Rates and Inflation". Bond prices move inverse to interest rates. The latest reading from Market Vane T-Bonds is only 49% down from the high of 83% made in mid-2016. This implies the US T-Bond market could decline much further before a Market Vane reading reaches the oversold zone at 30%. The Market Vane T-Bond data can be seen at: http://www.goldchartsrus.com/chartstemp/BarronsDB.php |
|
| Figure 2. TYX has broken above the multi-year declining trend line that began in early 2011. |
| Graphic provided by: BigCharts.com. |
| |
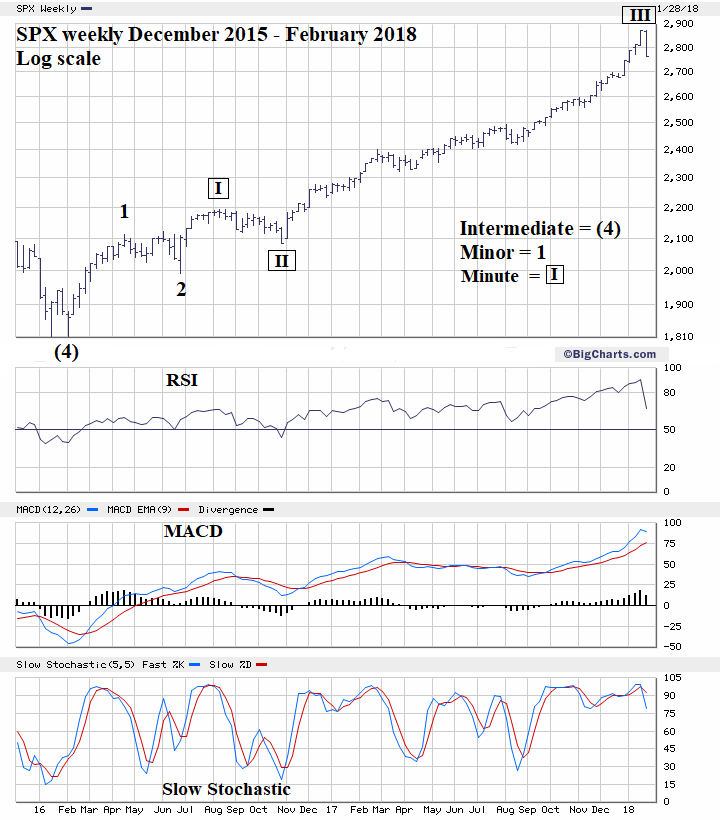
| S&P 500 Weekly Please see the weekly SPX chart illustrated in Figure 3. This is a follow up to my February 1 article "How High is Up?". The decline since the SPX all-time high of 2872.09 is the largest since the August 2016 - November 2016 decline of 110.02 points. The SPX low on February 2 of 2759.97 was 112.12 points from the 2872.09 top. Additionally, there is Fibonacci support at 2764.78 which is a .236 retrace of the rally from the August 21 bottom at 2417.35 to 2872.09. The near equality with the supposed Minute wave "II"-boxed decline implies the current decline could be part or a completed Minute wave "IV"-boxed. Does this decline mean it's time to go long the SPX? No, the momentum evidence from the weekly RSI, MACD, and Slow Stochastic imply the door could be open to more decline. The SPX could decline another 110 points, putting this decline at a two-to-one ratio to the Minute wave "II", which is a common wave "two" to "four" ratio. |
|
| Figure 3. The near equality with the supposed Minute wave "II"�boxed decline implies the current decline could be part or a completed Minute wave "IV"-boxed. |
| Graphic provided by: BigCharts.com. |
| |
| Summary and Strategy The DJUA exceptionally clear Elliott wave pattern and powerful signals from multiple indicators is something that only occurs once or twice a year in any market. The TYX and T-Bonds are giving signals that rates could continue to rise, possibly much higher. My February 1 article noted it will take time for the SPX just to slow down before changing direction. It appears the slowing down process has begun. The place to focus on in early February 2018 is clearly the DJUA. Reiterating — if the DJUA is in the range of 684 to 675, go long Utility stocks or funds. Use DJUA 673 as a stop loss. The activity in both the US stock and bond markets during the week of January 29-February 2 was like watching an action/adventure television show. Stay tuned in, the best is yet to come. Further Reading: Frost A.J and Robert Prechter (1985) "Elliott Wave Principle", New Classics Library. http://www.goldchartsrus.com/chartstemp/BarronsDB.php http://www.chartsrus.com/ |
Independent investment advisor, trader and writer. He has written articles for Technical Analysis of Stocks & Commodities, Traders.com Advantage,Futuresmag.com and, Finance Magnates. Author of website Four Dimension Trading.
| Website: | www.fourdimensiontrading.com |
| E-mail address: | markrivest@gmail.com |
Click here for more information about our publications!
Comments
Date:�02/08/18Rank:�4Comment:�

Request Information From Our Sponsors
- VectorVest, Inc.
- Executive Premier Workshop
- One-Day Options Course
- OptionsPro
- Retirement Income Workshop
- Sure-Fire Trading Systems (VectorVest, Inc.)
- Trading as a Business Workshop
- VectorVest 7 EOD
- VectorVest 7 RealTime/IntraDay
- VectorVest AutoTester
- VectorVest Educational Services
- VectorVest OnLine
- VectorVest Options Analyzer
- VectorVest ProGraphics v6.0
- VectorVest ProTrader 7
- VectorVest RealTime Derby Tool
- VectorVest Simulator
- VectorVest Variator
- VectorVest Watchdog
- StockCharts.com, Inc.
- Candle Patterns
- Candlestick Charting Explained
- Intermarket Technical Analysis
- John Murphy on Chart Analysis
- John Murphy's Chart Pattern Recognition
- John Murphy's Market Message
- MurphyExplainsMarketAnalysis-Intermarket Analysis
- MurphyExplainsMarketAnalysis-Visual Analysis
- StockCharts.com
- Technical Analysis of the Financial Markets
- The Visual Investor