

HOT TOPICS LIST
- MACD
- Fibonacci
- RSI
- Gann
- ADXR
- Stochastics
- Volume
- Triangles
- Futures
- Cycles
- Volatility
- ZIGZAG
- MESA
- Retracement
- Aroon
INDICATORS LIST
LIST OF TOPICS
PRINT THIS ARTICLE
by Mark Rivest
How to prepare for a trend change that could continue for decades.
Position: N/A
Mark Rivest
Independent investment advisor, trader and writer. He has written articles for Technical Analysis of Stocks & Commodities, Traders.com Advantage,Futuresmag.com and, Finance Magnates. Author of website Four Dimension Trading.
PRINT THIS ARTICLE
BULL/BEAR MARKET
The Prospect for Higher Interest Rates and Inflation
01/18/17 01:48:12 PMby Mark Rivest
How to prepare for a trend change that could continue for decades.
Position: N/A
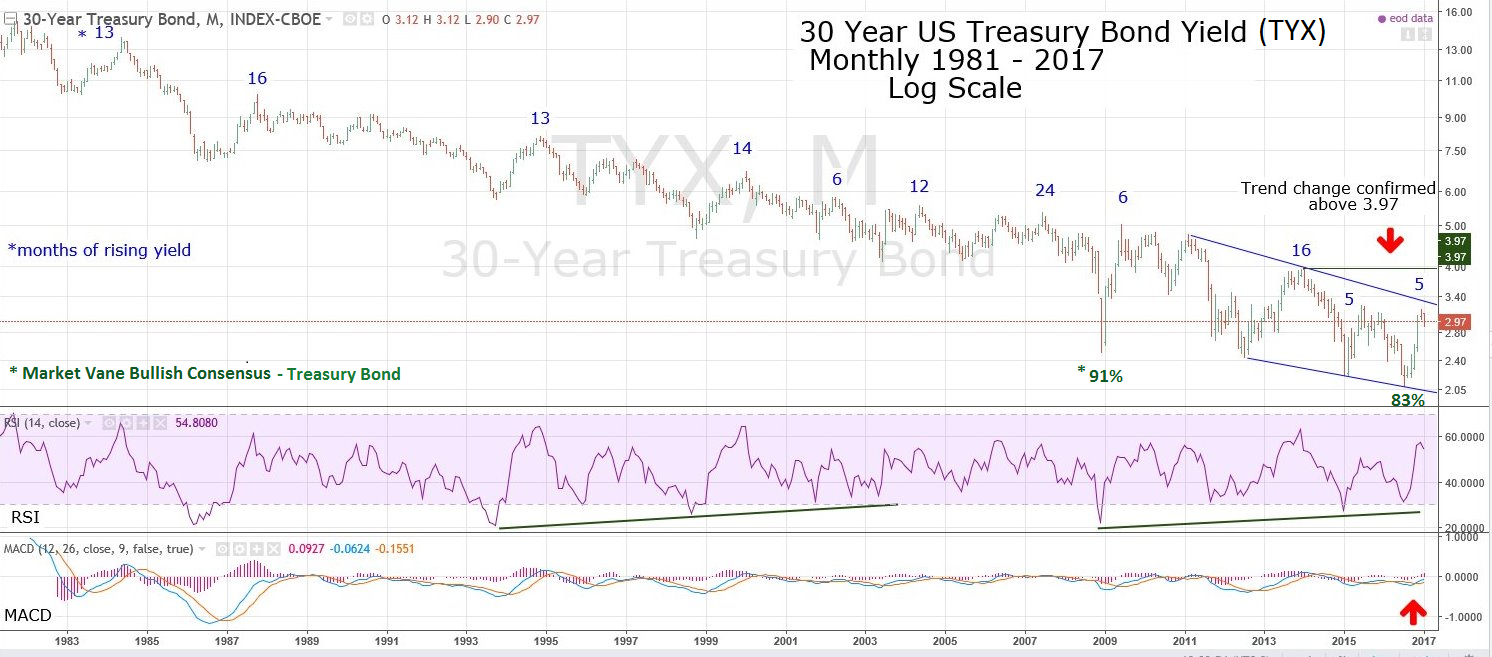
| In 2016 interest rates climbed along the US Treasury debt yield curve. Is this just another temporary blip up in a long-term trend down, or the start of a rise that could last decades? Charts for US Treasury Bond yields and gold hold clues that a major trend shift for interest rates and inflation may have begun. US Treasury Bond Yield Investment money will gravitate to where it is treated best. For more than thirty-four years long term interest rates as measured by US Treasury Bond yields have been declining. History has shown that since the inception of US Treasury debt in the 1790's trends have ranged from twenty to forty years. Ff the trend is now up the effects will span all asset classes. Please see the US Treasury Bond Yield (TYX) chart illustrated in Figure 1. This chart encompasses the entire secular bear market for Treasury Bond yield. Note that each move to new lows was followed by rallies that failed to exceed the prior primary top. This situation has continued to the present, so a case could be made that interest rates are still in a bear market, but recent evidence hints at a developing trend change. The July 2016 bottom had the following factors: 1) RSI double bearish divergence; 2) MACD bullish crossover; 3) sentiment divergence. These factors have occurred in the bear market before, and have signaled only partial retracements of the decline. One curious aspect — the first four months' rally gain from July 2016 is second only to the powerful first four months move up from the late 2008 bottom. This hints the bears are weakening. The bulls need to overcome two price hurdles: 1) exceed the intermediate peak of 3.25 made in June 2015; 2) exceed the primary top of 3.97 made in December 2013. Moving beyond 3.25 would be the biggest clue in thirty-five years that a trend change could be underway, confirmation of a secular bull market for interest rates is at 3.98. The corresponding confirmation level for the Ten-Year US Treasury Note Yield (TNX) is above the 3.04 level made in December 2013. |
|
| Figure 1. This chart encompasses the entire secular bear market for Treasury Bond yield. |
| Graphic provided by: Tradingview.com. |
| |
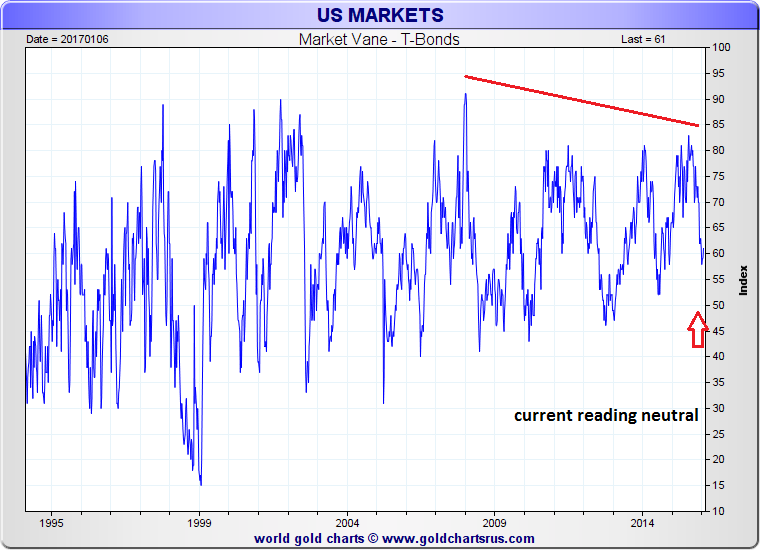
| Sentiment Dimension Please see the Market Vane Bullish Consensus - T Bonds chart illustrated in Figure 2. Market Vane, Inc. conducts polling of Futures traders bullish/bearish opinions to determine a bullish consensus number for markets. A very high percentage indicate excessive bullishness, very low percentages indicate excessive bearishness. Trend changes are likely to occur at extremes. This chart shows the bullish consensus readings for the Treasury Bond futures markets, where the high readings correspond with price highs which are the inverse of bond yields. The 91% reading at the end of 2008 perfectly corresponded to the peak in price and yield bottom. While extreme readings are great for catching intermediate turns, many times a primary market turn will come on a sentiment divergence. It's a subtle sign that sentiment has shifted before a turn is made. The higher price/lower yield of July 2016 vs. December 2008 had a significant consensus divergence, hinting at a weakening of the bullish forces in the Treasury Bond futures market. Falling bond prices equals rising interest rates. |
|
| Figure 2. The 91% reading at the end of 2008 perfectly corresponded to the peak in price and yield bottom. |
| Graphic provided by: Goldchartsrus.com. |
| |
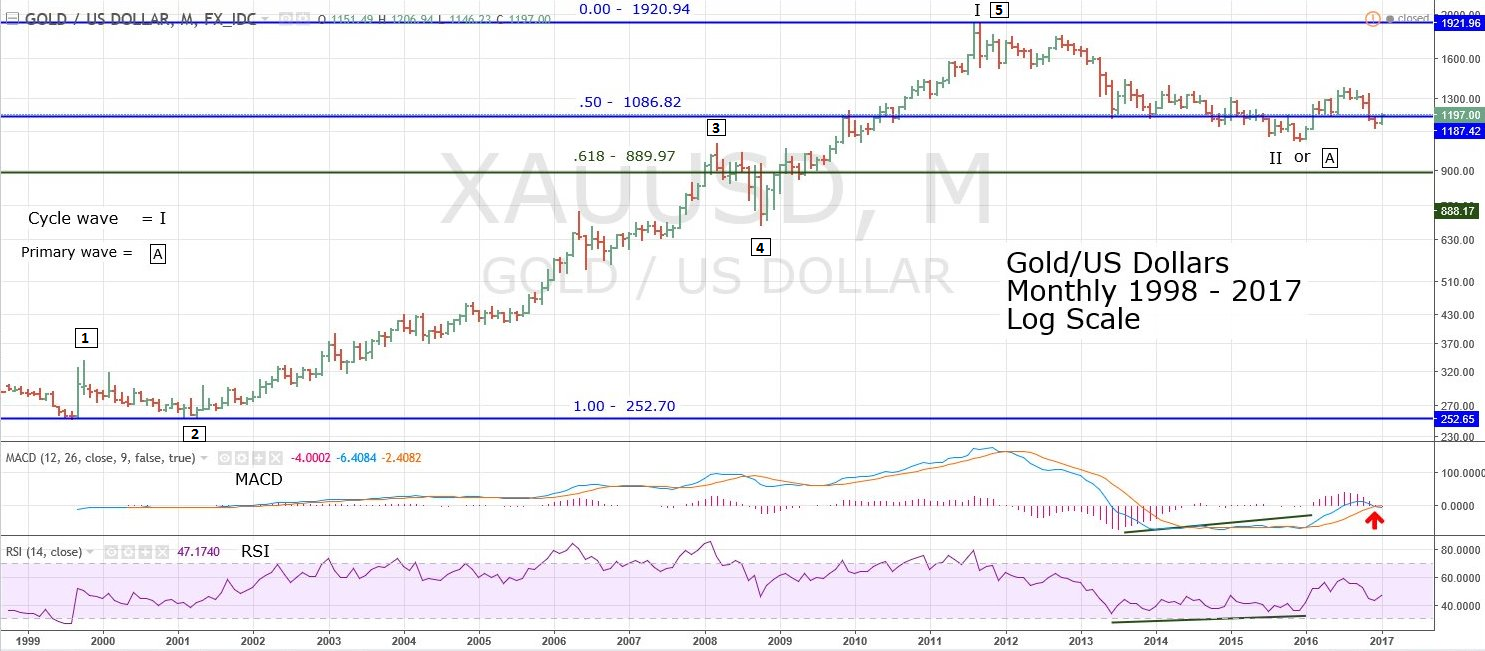
| Gold The common definition for inflation is — too much money chasing too few goods. With the excessive monetary growth since the 2008-2009 financial crisis, you don't need a PhD in Economics to figure out it's only a matter of when the inflation rates start to rise. One of the beneficiaries of inflation is Gold. Please see the Gold in US Dollars chart in Figure 3. From the major bear market bottom in 1999, Gold increased more than seven times into the 2011 peak. The subsequent four-year bear market retraced 52.4% of the bull market. The move from the bottom at 252.70 to the peak at 1920.24 looks like an Elliott impulse wave. If so, it's likely just the first wave up in a much larger developing five wave pattern. If the bear market is complete at the December 2015 bottom of 1046.54, the current price in the 1200 area could be a great entry point for a multi-year investment. If the next wave up has the same percentage gain as the 1999-2011 bull market, then seven times the 1046 bottom is 7322. Recently, the monthly MACD had a bullish crossover indicating a multi-month rally could be starting. However, the 2011-2015 bear market counts best as a five wave decline and the subsequent rally from December 2015 counts best as a corrective three waves. If this count is correct it implies the Gold bear market is incomplete and another wave down to new bear market lows could happen later in 2017 or 2018. The .618 retracement area at 890 is the most likely point for a new bottom. The area of 890 is also not too far the major Gold top at 850 made in early 1980. |
|
| Figure 3. If the bear market is complete at the December 2015 bottom of 1046.54, the current price in the 1200 area could be a great entry point for a multi-year investment. |
| Graphic provided by: Tradingview.com. |
| |
| Summary and Strategy Falling interest rates and low inflation trends have continued for decades. The change to a rising interest rate trend and high inflation may require a transition period of one to two years. That transition may have begun in 2016. The time to prepare for a secular change is now. Interest rate sensitive investments: Sell any Bond mutual funds. Unlike bonds, funds have no maturity date. In a rising interest rate environment their share values will keep falling. Ladder bond portfolios to five years. At each maturity date, proceeds can be invested into new bonds with higher rates. Inflation sensitive investments: Buy precious metals. Use dollar cost averaging and increase purchases if Gold reaches the 850-950 area. Finally, a quick update on the US stock market. My January 11th article "Dow 20,000 - The Elusive Nirvana" noted that on January 6th all three main US stock indices made new highs. Typically, significant US stock market peaks have at least one of the main Indexes not confirm the high. Subsequently the Nasdaq Composite has made a new all-time high unconfirmed by the other two main indices. This adds to the overwhelming bearish evidence for the US stock market. If the S&P 500 (SPX) has not traded above 2285.92, short 50% as soon as possible and use SPX 2285.93 as the stop loss. If still holding long positions, this could be the last time to liquidate at the most advantageous prices. Further Reading: Hadady R. Earl (1983) "Contrary Opinion", Key Books. Frost A.J and Robert Prechter (1985) "Elliott Wave Principle", New Classics Library. |
Independent investment advisor, trader and writer. He has written articles for Technical Analysis of Stocks & Commodities, Traders.com Advantage,Futuresmag.com and, Finance Magnates. Author of website Four Dimension Trading.
| Website: | www.fourdimensiontrading.com |
| E-mail address: | markrivest@gmail.com |
Click here for more information about our publications!
Comments

Request Information From Our Sponsors
- StockCharts.com, Inc.
- Candle Patterns
- Candlestick Charting Explained
- Intermarket Technical Analysis
- John Murphy on Chart Analysis
- John Murphy's Chart Pattern Recognition
- John Murphy's Market Message
- MurphyExplainsMarketAnalysis-Intermarket Analysis
- MurphyExplainsMarketAnalysis-Visual Analysis
- StockCharts.com
- Technical Analysis of the Financial Markets
- The Visual Investor
- VectorVest, Inc.
- Executive Premier Workshop
- One-Day Options Course
- OptionsPro
- Retirement Income Workshop
- Sure-Fire Trading Systems (VectorVest, Inc.)
- Trading as a Business Workshop
- VectorVest 7 EOD
- VectorVest 7 RealTime/IntraDay
- VectorVest AutoTester
- VectorVest Educational Services
- VectorVest OnLine
- VectorVest Options Analyzer
- VectorVest ProGraphics v6.0
- VectorVest ProTrader 7
- VectorVest RealTime Derby Tool
- VectorVest Simulator
- VectorVest Variator
- VectorVest Watchdog