

HOT TOPICS LIST
- MACD
- Fibonacci
- RSI
- Gann
- ADXR
- Stochastics
- Volume
- Triangles
- Futures
- Cycles
- Volatility
- ZIGZAG
- MESA
- Retracement
- Aroon
INDICATORS LIST
LIST OF TOPICS
PRINT THIS ARTICLE
by Mark Rivest
Apple appears to have begun a decline. Where are the support levels and what effect could this have on the broader stock market?
For several years Apple Inc. (AAPL) has been one of the main leaders in the stock market. As of September 22, 2017, AAPL is up 69% from its last significant bottom on May 12, 2016. The S&P 500 (SPX) is up only 21%. From the start of 2017 AAPL is up 32% vs. 11% for the SPX.
AAPL made its all-time high of 164.94 on September 1, 2017. Since then it has been in a decline while the SPX has continued to rise. Is this decline just a symptom of AAPL's performance as a company, or does it have implications for the broader stock market? A look at AAPL's history reveals interesting clues to what may happen in October 2017.
Position: Sell
Mark Rivest
Independent investment advisor, trader and writer. He has written articles for Technical Analysis of Stocks & Commodities, Traders.com Advantage,Futuresmag.com and, Finance Magnates. Author of website Four Dimension Trading.
PRINT THIS ARTICLE
STOCKS
Follow the Leader - Apple
09/28/17 04:06:11 PMby Mark Rivest
Apple appears to have begun a decline. Where are the support levels and what effect could this have on the broader stock market?
For several years Apple Inc. (AAPL) has been one of the main leaders in the stock market. As of September 22, 2017, AAPL is up 69% from its last significant bottom on May 12, 2016. The S&P 500 (SPX) is up only 21%. From the start of 2017 AAPL is up 32% vs. 11% for the SPX.
AAPL made its all-time high of 164.94 on September 1, 2017. Since then it has been in a decline while the SPX has continued to rise. Is this decline just a symptom of AAPL's performance as a company, or does it have implications for the broader stock market? A look at AAPL's history reveals interesting clues to what may happen in October 2017.
Position: Sell
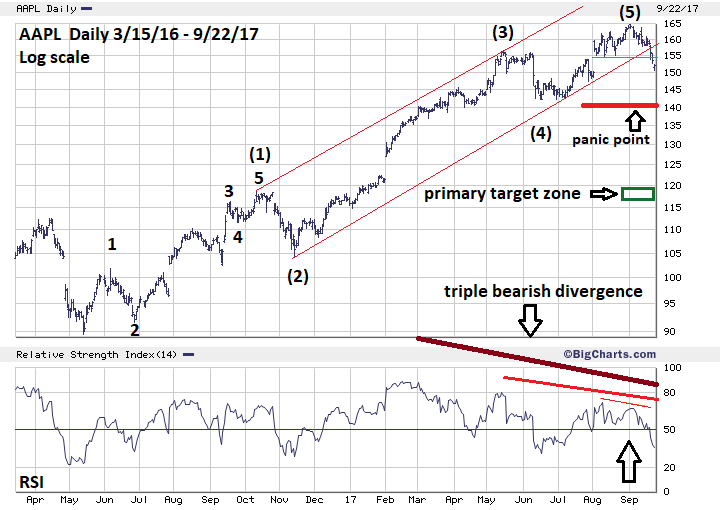
| AAPL Daily Please see the AAPL daily chart illustrated in Figure 1. There's a wealth of information that can be derived from this chart. First is the rare triple bearish divergence on the daily RSI, this is a powerful clue that AAPL may have begun the largest decline since May 2016. Next is the break of the near perfect parallel channel that AAPL has traveled within for almost a year. Finally, most fascinating of all, is the text book Elliott wave pattern AAPL has formed since its May 12, 2016 bottom. Elliott waves track emotional patterns of the crowd. Stock market indices, such as the SPX, because of their wide spread exposure to the crowd, are usually the best vehicles to see clear Elliott patterns. Because each company has its own unique personality, their stock price patterns many times may not reflect patterns of the crowd. This factor sometimes makes it difficult for clear Elliott wave patterns to form. APPL from May 2016 to September 2017 is the exception. The Elliott wave pattern May 2016-September 2017 is incredibly clear and detailed. All five of the Intermediate degree waves labeled (1) through (5) have text book proportions. Within Intermediate wave (1) the sub divisions of the next lower degree waves labeled 1 through 5 are also very clear and proportioned. This is one of the best Elliott wave patterns you will ever find and it's much clearer than even the SPX daily pattern of 2016-2017. If an Elliott five-wave pattern was completed on the September 1, 2017 top at 164.94, it implies at the very least a three wave decline that would be in proportion to the prior five-wave rally. The decline could last several months with the 38% and 62% retracement levels as the most likely zones to find significant support. My September 19th article "The Perfect Storm" noted the SPX daily price structure is set up like a series of dominos, where the break of one support area could lead to a rapid attack upon the next support zone leading ultimately to a mini crash. This phenomenon may have already begun for AAPL. First, on September 20 AAPL broke below the rising daily trend line from November 2016. Next was the break below the triple bottom in the 154-155 areas. The still rising 200-day simple moving average was at 142.28 on September 22 — could be the next target the bears will attack. Very close by is considerable support in the 140-142 areas. If the bears can smash through both these barriers it could trigger a panic that blows right through the 38% Fibonacci support in the 136-zone bringing AAPL quickly down to the next support of a 62% retrace at 117-119. |
|
| Figure 1. The Elliott wave pattern May 2016-September 2017 is incredibly clear and detailed. |
| Graphic provided by: BigCharts.com. |
| |
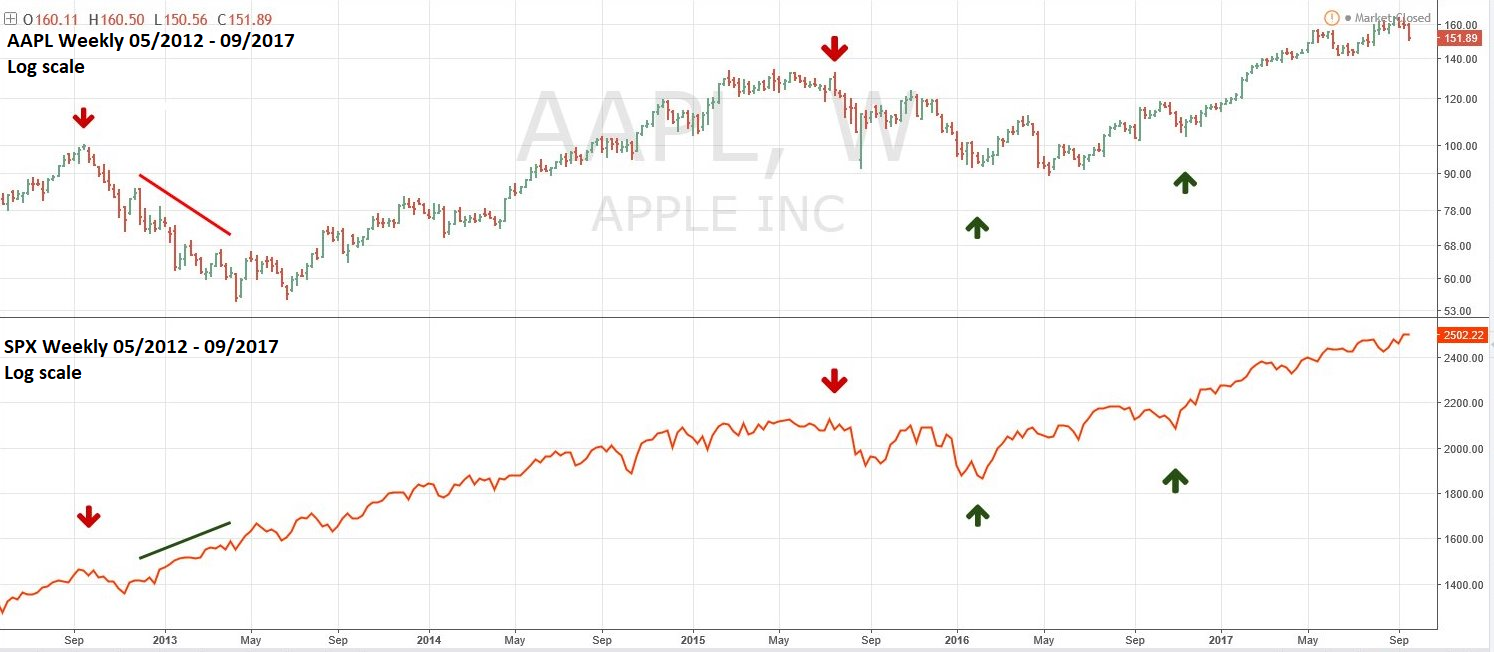
| AAPL Weekly Please see the AAPL/SPX weekly chart illustrated in Figure 2. Could the recent AAPL decline be related to only potential weakness of the company and have nothing to do with the performance of the broader stock market? Of course, this happened in late 2012 to early 2013 when AAPL continued to decline as the SPX rallied. The big difference is when, in the broader stock market cycle, the recent AAPL decline is happening. Please see my April 21 article "Global Non-Confirmation" and my May 10 article "The Price is Right" which noted the three phases of a stock bull market. The AAPL 2012-2013 decline was at the beginning of the recognition phase in the global bull market when most national stock indices and stocks had confirmations of new highs. The APPL decline was an aberration. The same can't be said in September 2017. Speculation and complacency have been growing in the stock market for months. Non-confirmations of new highs have been rampant. AAPL's recent non-confirmation of the new highs of the main three US stock indices is just another in a long and growing list of stocks underperforming the market averages. |
|
| Figure 2. AAPL�s recent non-confirmation of the new highs of the main three US stock indices is just another in a long and growing list of stocks underperforming the market averages. |
| Graphic provided by: tradingview.com. |
| |
| Summary and Strategy AAPL has led the stock market for months. Its recent decline is perhaps the strongest signal yet that most stocks could be on the verge of a rapid decline. Even if you don't own AAPL, this stock needs to be watched. On September 20, the SPX hit its all-time high of 2508.85. Continue to hold 50% short stocks and use SPX 2510 as a stop loss. If the SPX breaks below 2405.70, increase the short position to 100%. On September 21, the Dow Jones Industrial Average hit its all-time high unconfirmed by the other two main US stock indexes. If the thirty-four-day mini crash phenomenon is in effect the new bulls-eye target date for a mini crash bottom is October 24, 2017. SPX 2120-2160 remains the price target zone. Further reading: Frost A.J and Robert Prechter (1985) "Elliott Wave Principle", New Classics Library. |
Independent investment advisor, trader and writer. He has written articles for Technical Analysis of Stocks & Commodities, Traders.com Advantage,Futuresmag.com and, Finance Magnates. Author of website Four Dimension Trading.
| Website: | www.fourdimensiontrading.com |
| E-mail address: | markrivest@gmail.com |
Click here for more information about our publications!
Comments
Date:�11/03/17Rank:�4Comment:�

Request Information From Our Sponsors
- StockCharts.com, Inc.
- Candle Patterns
- Candlestick Charting Explained
- Intermarket Technical Analysis
- John Murphy on Chart Analysis
- John Murphy's Chart Pattern Recognition
- John Murphy's Market Message
- MurphyExplainsMarketAnalysis-Intermarket Analysis
- MurphyExplainsMarketAnalysis-Visual Analysis
- StockCharts.com
- Technical Analysis of the Financial Markets
- The Visual Investor
- VectorVest, Inc.
- Executive Premier Workshop
- One-Day Options Course
- OptionsPro
- Retirement Income Workshop
- Sure-Fire Trading Systems (VectorVest, Inc.)
- Trading as a Business Workshop
- VectorVest 7 EOD
- VectorVest 7 RealTime/IntraDay
- VectorVest AutoTester
- VectorVest Educational Services
- VectorVest OnLine
- VectorVest Options Analyzer
- VectorVest ProGraphics v6.0
- VectorVest ProTrader 7
- VectorVest RealTime Derby Tool
- VectorVest Simulator
- VectorVest Variator
- VectorVest Watchdog