HOT TOPICS LIST
- MACD
- Fibonacci
- RSI
- Gann
- ADXR
- Stochastics
- Volume
- Triangles
- Futures
- Cycles
- Volatility
- ZIGZAG
- MESA
- Retracement
- Aroon
INDICATORS LIST
LIST OF TOPICS
PRINT THIS ARTICLE
by Mark Rivest
See why conditions from all four stock market dimensions indicate a sharp decline September-October 2017.
Position: Sell
Mark Rivest
Independent investment advisor, trader and writer. He has written articles for Technical Analysis of Stocks & Commodities, Traders.com Advantage,Futuresmag.com and, Finance Magnates. Author of website Four Dimension Trading.
PRINT THIS ARTICLE
MARKET TIMING
The Perfect Storm
09/19/17 04:16:22 PMby Mark Rivest
See why conditions from all four stock market dimensions indicate a sharp decline September-October 2017.
Position: Sell
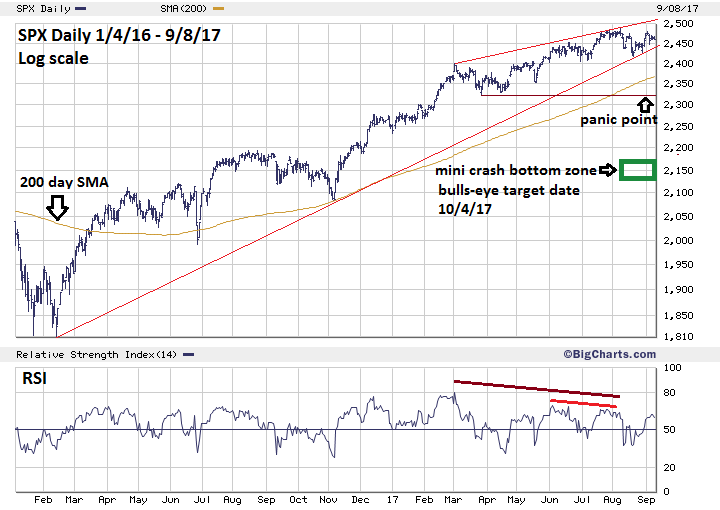
| For several months, the global stock market has been poised for a significant decline. April-May 2017 had near ideal conditions for a large stock market decline, yet the bull market still slowly continued. As of early September 2017, all three US main stocks indices are near their all-time highs. September-October is the most bearish season for stocks. Evidence from the other market dimensions of price, sentiment and momentum also indicate ideal conditions for a sharp stock market decline. The stage is set for a perfect stock market storm which could smash the S&P 500 (SPX) down 13 to 17% during September-October 2017. Price and Time Dimensions My September 8 article "The Thirty-Four Day Mini Crash Phenomenon" and my August 3 article "Amazing Parallels of 2015 and 2017" noted that the SPX mini crashes of 2011 and 2015 both occurred after the SPX broke below its 200-day simple moving average (SMA) and major support. Additional conditions from the price dimension could trigger a domino effect, where if one support area is broken, the bears can quickly attack the next support area. If this occurs, more and more sellers would add to the decline until a crescendo of panic is reached. Please see the Daily SPX chart illustrated in Figure 1. This is the sequence of events that could happen: 1) The SPX breaks below the rising trend line from the February 2016 bottom. 2) The bears then attack nearby support at 2405. If breached, this could bring in more sellers. 3) The bears could then attempt to push the SPX below the 200-day SMA, which as of September 8 was at SPX 2368. If this line is successfully breached it could trigger additional selling from traders and investors that make decisions based upon the 200-day SMA. 4) Finally, a panic could develop if the bears can smash below significant support at SPX 2322. Panic selling could bring the SPX down to the 2120-2160 area in just one trading day. Time Dimension My prior article noted a possible mini crash bottom on September 11 based upon the thirty-four-day mini crash phenomenon. This won't happen. Perhaps the SPX secondary top at 2480 on September 1 could be the point of origin for a thirty-four-day mini crash. If so, the bulls-eye target for a mini crash bottom could be October 4, 2017. |

|
| Figure 1. Additional conditions from the price dimension could trigger a domino effect where if one support area is broken the bears can quickly attack the next support area. |
| Graphic provided by: BigCharts.com. |
| |
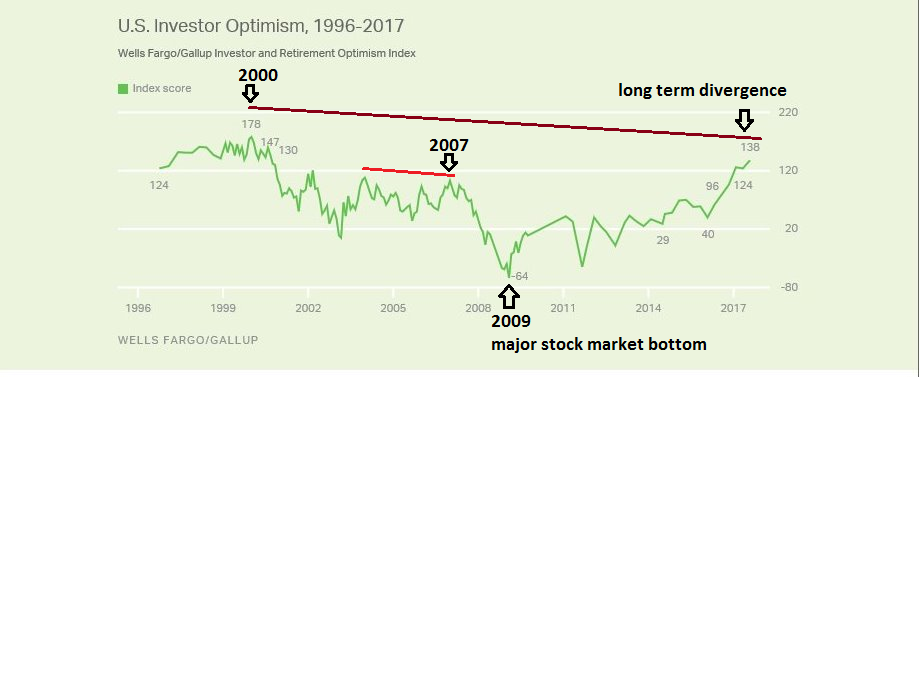
| Sentiment Dimension Please see the Wells Fargo/Gallup Investor and Retirement Optimism Index in Figure 2. This index gives an excellent overview of stock market sentiment from 1996 to September 2017. Several of my articles have noted that the best signals for stock market peaks come when sentiment readings diverge from their extreme while stocks indices make higher highs. This phenomenon happened from 2004 to 2007. The Optimism index peaked in 2004 then made a lower high in 2007 while the SPX was well above the levels it recorded in 2004. A similar divergence could be happening regarding the current Optimism index reading which is below the level recorded in 2000, while the SPX is currently well above the level it was trading during 2000. The Optimism index could be in the process of exceeding the levels recorded in 2000 but this is highly unlikely. The insane levels of speculation reached in 1999-2000 were at the same level as 1928-1929, which subsequently lead to a crash and depression. Seventy years separated the two manias. It's possible that at least two generations of traders/investors should pass before a super stock mania can occur. Since it has only been seventeen years since the last stock mania, it's most likely there are too many current traders/investors with memories of the last mania bursting which could prevent another super mania developing for at least another thirty years. From a long and short-term perspective — please see the daily VIX chart illustrated in September 8 article — sentiment is ideal for a sharp drop in stock prices. |

|
| Figure 2. Investor Optimism. This index gives an excellent overview of stock market sentiment from 1996 to September 2017. |
| Graphic provided by: Wells Fargo/Gallup. |
| |
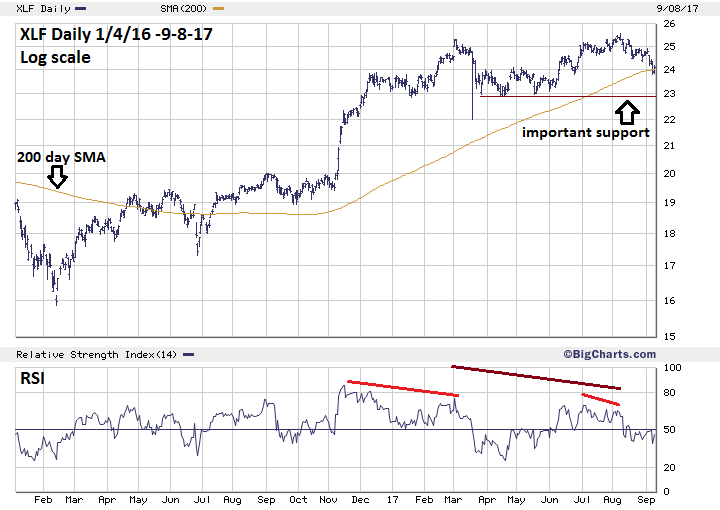
| Momentum Dimension My July 14 article "A Ludicrous Non- Confirmation - The Sequel" noted on July 3, 2017 the Dow Jones Industrial Average made an all-time high that was unconfirmed by nearly every other stock index. Nearly two months later the ludicrous non-confirmations continue. On September 1, 2017, the Nasdaq 100 (NDX) made an all-time high that was unconfirmed by the three main US stock indices. This peak was confirmed by only two of the nine SPDR sector ETF funds, Technology (XLK) and Health Care (XLV). Even more shocking, of the market leading FAANG stocks, Facebook (FB), Amazon.com (AMZN), Apple (AAPL), Netflix (NFLX) and Alphabet (GOOGL), only AAPL could make a new all-time high on September 1. Please see the Daily SPDR sector ETF fund (XLF) - Financial - illustrated in Figure 3. From its March 2 peak to the August 8 high, the XLF has been significantly lagging the SPX. XLF now appears to be leading the way down. On September 7th XLF broke below its 200-day SMA and appears poised to test important support at 22.89. If this very important sector fund was to break below 22.89 it could be a catalyst for increased selling in the broader stock market. Evidence from NDX and XLF indicate momentum is ideal for a sharp drop in stock prices. |

|
| Figure 3. XLF Daily. If this very important sector fund was to break below 22.89 it could be a catalyst for increased selling in the broader stock market. |
| Graphic provided by: BigCharts.com. |
| |
| Summary and Strategy September-October is seasonally the most bearish time for stocks. The SPX price structure is set up for a domino effect of selling that could bring this index quickly down to the 2120-2160 area. Long and short-term sentiment indicators have bearish divergences that hint that bears could be taking control. For almost two months there have been ludicrous bearish momentum divergences. The global stock market is poised for a perfect storm, you could call this a "Bearicane". Its level is category five and it could bring about a rapid steep decline for stocks September-October 2017. Hold 50% short stocks and use SPX 2510 as a stop loss. Change in strategy for add on: If the SPX breaks below 2405.70, increase the short position to 100% and use SPX 2480.50 as the stop for the second 50%. When a hurricane approaches defensive action, such as evacuation, could save your life. When a "Bearicane" approaches, evacuating long stock positions could save your portfolio. Further Reading: Hadady R. Earl (1983) "Contrary Opinion", Key Books. |
Independent investment advisor, trader and writer. He has written articles for Technical Analysis of Stocks & Commodities, Traders.com Advantage,Futuresmag.com and, Finance Magnates. Author of website Four Dimension Trading.
| Website: | www.fourdimensiontrading.com |
| E-mail address: | markrivest@gmail.com |
Click here for more information about our publications!
PRINT THIS ARTICLE

Request Information From Our Sponsors
- VectorVest, Inc.
- Executive Premier Workshop
- One-Day Options Course
- OptionsPro
- Retirement Income Workshop
- Sure-Fire Trading Systems (VectorVest, Inc.)
- Trading as a Business Workshop
- VectorVest 7 EOD
- VectorVest 7 RealTime/IntraDay
- VectorVest AutoTester
- VectorVest Educational Services
- VectorVest OnLine
- VectorVest Options Analyzer
- VectorVest ProGraphics v6.0
- VectorVest ProTrader 7
- VectorVest RealTime Derby Tool
- VectorVest Simulator
- VectorVest Variator
- VectorVest Watchdog
- StockCharts.com, Inc.
- Candle Patterns
- Candlestick Charting Explained
- Intermarket Technical Analysis
- John Murphy on Chart Analysis
- John Murphy's Chart Pattern Recognition
- John Murphy's Market Message
- MurphyExplainsMarketAnalysis-Intermarket Analysis
- MurphyExplainsMarketAnalysis-Visual Analysis
- StockCharts.com
- Technical Analysis of the Financial Markets
- The Visual Investor
