

HOT TOPICS LIST
- MACD
- Fibonacci
- RSI
- Gann
- ADXR
- Stochastics
- Volume
- Triangles
- Futures
- Cycles
- Volatility
- ZIGZAG
- MESA
- Retracement
- Aroon
INDICATORS LIST
LIST OF TOPICS
PRINT THIS ARTICLE
by Mark Rivest
Could September 11, 2017 mark the bottom of a stock market mini crash?
Position: Sell
Mark Rivest
Independent investment advisor, trader and writer. He has written articles for Technical Analysis of Stocks & Commodities, Traders.com Advantage,Futuresmag.com and, Finance Magnates. Author of website Four Dimension Trading.
PRINT THIS ARTICLE
MARKET TIMING
The Thirty-Four Day Mini Crash Phenomenon
09/08/17 12:55:35 PMby Mark Rivest
Could September 11, 2017 mark the bottom of a stock market mini crash?
Position: Sell
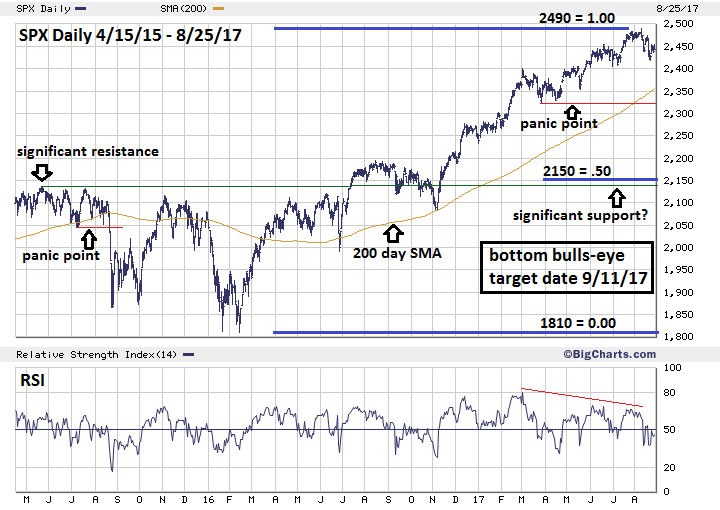
| A rare combination of factors from the dimensions of price, time, sentiment, and momentum indicate that conditions are ripe for a global stock market mini crash. The S&P 500 (SPX) could decline into the 2160-2120 area and bottom on September 11, 2017. Price Dimension Please see the 2015-2017 SPX chart illustrated in Figure 1. My August 3, 2017 article "Amazing Parallels of 2015 and 2017" noted that the SPX mini crashes of 2011 and 2015 both occurred after the SPX broke below its 200-day simple moving average (SMA) and major support. In both of those years the SPX had been in steady rallies for several months and all prior correction bottoms held. The combination of lengthy rallies followed by breaks of the 200-day SMA and prior significant support are the ingredients for the crowd to head for the exit. The result is a rapid mass liquidation of stocks and panic. The current phase of the SPX bull market began in February 2016 at 1810. Since then there have been three significant correction bottoms: June 2016 at 1991, November 2016 at 2083, and March 2017 at 2322. If the March 2017 correction bottom is breached it will be the first time since February 2016 that significant support has been broken. The SPX 200-day SMA on August 25, 2017 was at 2355. If, very soon, the SPX broke below 2322 it will also have a decisive break below the 200-day SMA, probably triggering a panic. A break below SPX 2322 could open the door to reach the next significant support area near the November 2016 bottom at 2083. In May 2015, the SPX had significant resistance at 2134 and retested this area in July 2015 at 2132. This prior resistance could become significant support after a break below SPX 2322. There's also Fibonacci support at 2150 which is a .50 retrace of the bull move from 1810 to 2490. Several of my articles noted that the SPX may have begun an Elliott primary degree five wave pattern at the June 2010 bottom of 1010. If the pattern is complete at 2490 a .236 retrace of the 1480-point rally targets SPX 2141 as possible support. The price zone for a possible SPX mini crash bottom is 2160 to 2120. |
|
| Figure 1. A break below SPX 2322 could open the door to reach the next significant support area near the November 2016 bottom at 2083. |
| Graphic provided by: BigCharts.com. |
| |
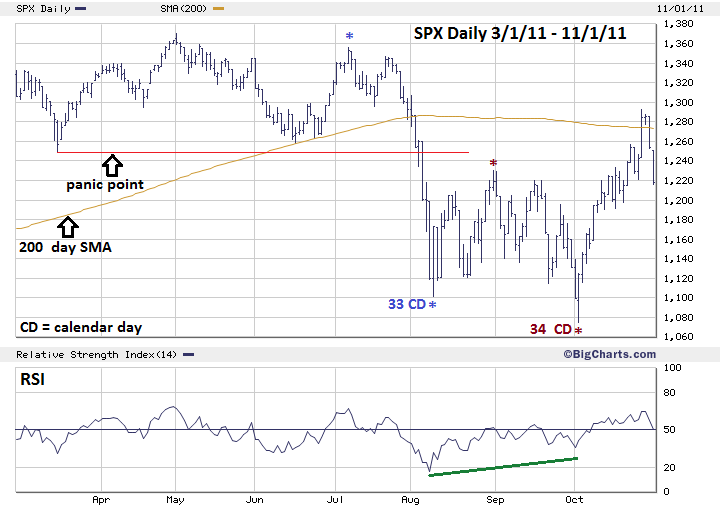
| Time Dimension R.N. Elliott discovered not only the Wave Principle, but also that markets move in time segments related to the Fibonacci sequence (1, 1, 2, 3, 5, 8, 13, 21, 34, 55, 89, 144, 233, to infinity). The segments can be in either trading days or calendar days. My June 24, 2016 article "The Brexit Factor" illustrates using trading days to determine that June 27, 2016 could be an important bottom. One of the earliest and dramatic examples of a market moving in segments of Fibonacci calendar days comes from the 1929 crash. September 3, 1929 the Dow Jones Industrial Average (DJIA) eight- year bull market hit its highest level. October 29, 1929 had the highest daily volume and marked the end of the most dynamic portion of the 1929 crash. September 3 to October 29 is 55 calendar days — a Fibonacci sequence number. On August 25, 1987 both the DJIA and SPX made all-time highs. October 19, 1987 was the most dynamic day of the 1987 crash. Both the DJIA and SPX made marginal new lows on October 20; most of the decline in price and time occurred in 55 calendar days August 25 to October 19. Please see the 2011 daily SPX chart illustrated in Figure 2. The 55 calendar day crash phenomenon is rare, the next lower Fibonacci sequence number, 34, is more frequent and associated with mini crashes. The SPX had two of them in 2011. The first came July 7, 2011 to August 9, 2011. The FOMC made an announcement on August 9. After the announcement, the SPX declined and bottomed late in the trading session on August 9th. The FOMC was probably the reason 34-day calendar crash was slightly truncated. The final part of the SPX 2011 bear move was August 31 to October 4 in 34 calendar days. The following is a list of the 34 calendar day crashes for the DJIA and SPX from 2006 to 2016: 12/17/15 to 1/20/16 DJIA -13.01% in 34 calendar days. 7/20/15 to 8/24/15 SPX -12.49% in 35 calendar days. SPX bottomed very early on 8/24/15 the bulk of the decline was on the Sunday 8/23/15 overnight futures session. 5/1/12 to 6/4/12 SPX -10.56% in 34 calendar days. 8/31/11 to 10/4/11 SPX -12.73% in 34 calendar days. 7/7/11 to 8/9/11 SPX -18.87% in 33 calendar days, truncated by FOMC. 5/10/06 to 6/14/06 DJIA -8.33% in 35 calendar days, FOMC announcement on June 14. |
|
| Figure 2. The 55 calendar day crash phenomenon is rare. The next lower Fibonacci sequence number, 34, is more frequent and associated with mini crashes. |
| Graphic provided by: BigCharts.com. |
| |
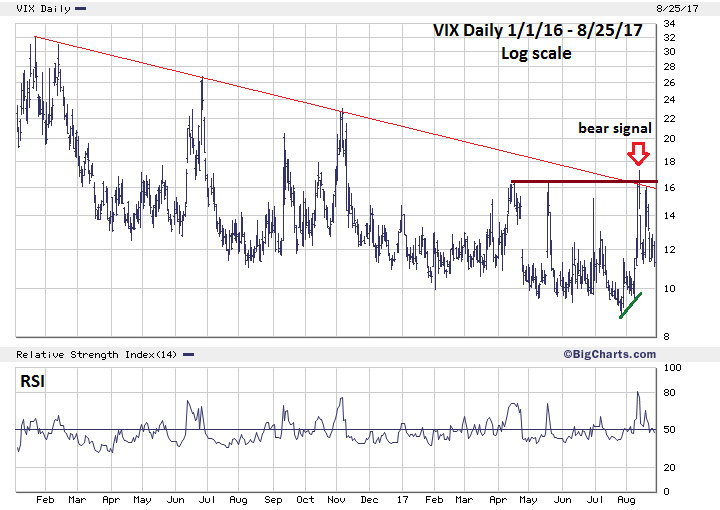
| Sentiment Dimension Please see the daily VIX chart illustrated in Figure 3. On August 11, 2017, the VIX gave a very powerful signal. For the first time since early 2016 when the SPX began its multi-month rally, the VIX broke above the declining trendline and an important recent double top. This is a sign that sentiment is now shifting from the bulls to the bears. If this signal is correct the bears could now be in control. The signal implies that the next SPX decline will be larger than the approximately 5% corrections that have occurred in the SPX since early 2016. Assuming the SPX bull phase from 1810 to 2490 is complete, the next decline will probably be at least of the same degree. The drop at a minimum could last at least two months, and decline possibly 13 to 17%. |
|
| Figure 3. This is a sign that sentiment is now shifting from the bulls to the bears. If this signal is correct the bears could now be in control. |
| Graphic provided by: BigCharts.com. |
| |
| Conclusion and Strategy The SPX all-time high on August 8 to September 11 is 34 calendar days. For several months fewer and fewer stocks have participated in the rally. The VIX very low readings prior to August 8 are signs of trader extreme complacency. The persistence of the rally has now brought the major stock indices into the seasonally bearish time zone of mid-August to early November. There's a very high probability that the decline from August 8 is just the beginning of a much larger correction. September 11, 2017 is the most likely date for a mini crash bottom. If not, the next best date is September 20th — the next FOMC announcement. Hold 50% short stocks and use SPX 2510 as a stop loss. If not currently short stocks, short 50% as soon as possible. If the SPX breaks below 2322.30 increase the short position to 100% and use SPX 2370 as the stop for the second 50%. It's been so long since the SPX has had more than a 5% decline most traders have probably forgotten what a larger correction is like. Very soon they could be receiving a bear market refresher course. Further Reading: Frost A.J and Robert Prechter (1985) "Elliott Wave Principle", New Classics Library. |
Independent investment advisor, trader and writer. He has written articles for Technical Analysis of Stocks & Commodities, Traders.com Advantage,Futuresmag.com and, Finance Magnates. Author of website Four Dimension Trading.
| Website: | www.fourdimensiontrading.com |
| E-mail address: | markrivest@gmail.com |
Click here for more information about our publications!
PRINT THIS ARTICLE

Request Information From Our Sponsors
- StockCharts.com, Inc.
- Candle Patterns
- Candlestick Charting Explained
- Intermarket Technical Analysis
- John Murphy on Chart Analysis
- John Murphy's Chart Pattern Recognition
- John Murphy's Market Message
- MurphyExplainsMarketAnalysis-Intermarket Analysis
- MurphyExplainsMarketAnalysis-Visual Analysis
- StockCharts.com
- Technical Analysis of the Financial Markets
- The Visual Investor
- VectorVest, Inc.
- Executive Premier Workshop
- One-Day Options Course
- OptionsPro
- Retirement Income Workshop
- Sure-Fire Trading Systems (VectorVest, Inc.)
- Trading as a Business Workshop
- VectorVest 7 EOD
- VectorVest 7 RealTime/IntraDay
- VectorVest AutoTester
- VectorVest Educational Services
- VectorVest OnLine
- VectorVest Options Analyzer
- VectorVest ProGraphics v6.0
- VectorVest ProTrader 7
- VectorVest RealTime Derby Tool
- VectorVest Simulator
- VectorVest Variator
- VectorVest Watchdog