

HOT TOPICS LIST
- MACD
- Fibonacci
- RSI
- Gann
- ADXR
- Stochastics
- Volume
- Triangles
- Futures
- Cycles
- Volatility
- ZIGZAG
- MESA
- Retracement
- Aroon
INDICATORS LIST
LIST OF TOPICS
PRINT THIS ARTICLE
by Mark Rivest
See why the US stock market could fall fifteen percent in just three weeks.
Position: Sell
Mark Rivest
Independent investment advisor, trader and writer. He has written articles for Technical Analysis of Stocks & Commodities, Traders.com Advantage,Futuresmag.com and, Finance Magnates. Author of website Four Dimension Trading.
PRINT THIS ARTICLE
MARKET TIMING
October Surprise
10/21/16 01:30:33 PMby Mark Rivest
See why the US stock market could fall fifteen percent in just three weeks.
Position: Sell
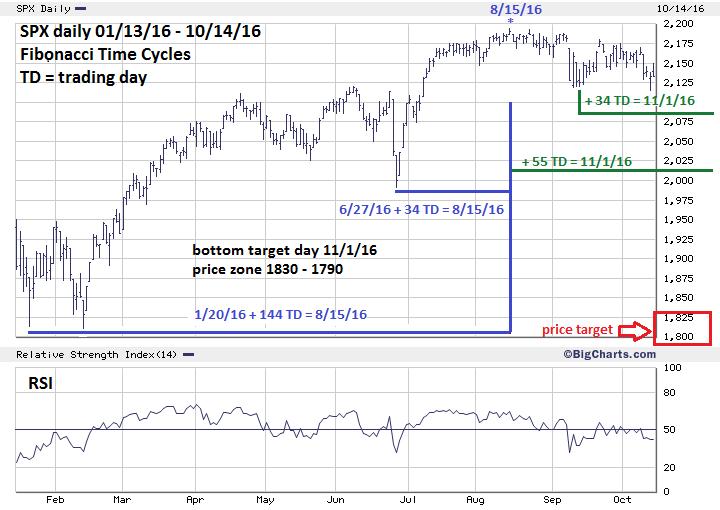
| Since early July the S&P 500 (SPX) has been trading in a narrow range from 2110 to 2190 while a tremendous amount of evidence has been indicating an important top could be forming. In September the SPX made a correction low at 2119, then made a marginal new low at 2114 in October. The 2114 - 2119 level is a logical support area because a Fibonacci .382 retrace of the rally from the Brexit bottom at 1991 to the August high of 2193 is at SPX 2116. On October 14th the SPX closed at 2133. If within the next few trading days the SPX were to break below 2114 it could trigger a sharp decline to the low 1800 area by late October or early November. Fibonacci Time and Price Targets Several of my articles have made note of SPX trend changes that could be measured by using the Fibonacci sequence. Please see my article "Stock Market Lesson From Mr. Fibonacci". The Fibonacci Sequence is as follows (1, 1, 2, 3, 5, 8, 13, 21, 34, 55, 89, 144, 233, to infinity). Please see the daily SPX chart illustrated in Figure 1. The SPX all-time high made on August 15th is the nexus for the bottoms made January, June and September. Adding 55 trading days to the August 15th top targets November 1st as a possible turn date. Adding 34 trading days to the September 14th bottom targets November 1st. Additionally, 55/34 is the Fibonacci "Golden Ratio" of 1.618, which can also be used to forecast market turns. This technique is illustrated in "The Definitive Guide to Futures Trading" by Larry Williams. My article "Nasdaq Versus The World" noted the SPX from the February 11th bottom may have formed an Elliott wave Ending Diagonal Triangle. In rising markets this structure, when complete, usually retraces rapidly to the point of origin — in this case SPX 1810. |
|
| Figure 1. Adding 55 trading days to the August 15th top targets November 1st as a possible turn date. |
| Graphic provided by: BigCharts.com. |
| |
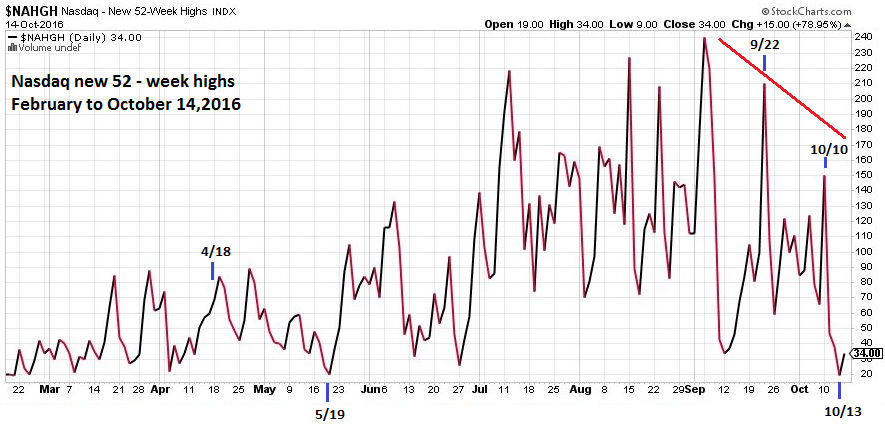
| Momentum On September 22nd the Nasdaq 100 (NDX) made a new all-time high that was confirmed by the Nasdaq Composite and the SPDR Technology Fund (XLK). On October 10th the NDX made another new all-time high confirmed by just XLK — that's only part of the bearish picture. Please see the Nasdaq 52- week high chart illustrated in Figure 2. The NDX October 10th peak was made on a significant double bearish divergence from the maximum number of new 52-week highs recorded in early September. The 1.8 % NDX decline after October 10th brought the number of new 52-week highs to only 19. From the April 18th peak the NDX declined 5.5% into the low made on May 19th and recorded 20 new 52-week highs. Declining from a higher level on October 10th in a much smaller decline than the April-May drop, the number of stocks at 52-week highs collapsed! This is the internal momentum of the last US index to make an all-time high. It's a shockingly bearish message and implies that the external momentum — the index itself — is on the verge of collapse. |
|
| Figure 2. Declining from a higher level on October 10th in a much smaller decline than the April-May drop, the number of stocks at 52�week highs collapsed! |
| Graphic provided by: StockCharts.com. |
| |
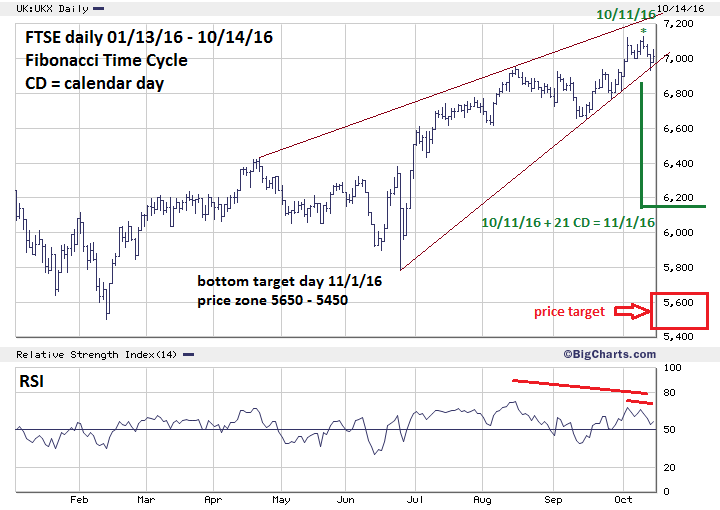
| FTSE 100 Versus The World Please see the FTSE daily chart illustrated in Figure 3. The FTSE may be the last major index in the world to make a new all-time high in 2016. On October 11th it moved marginally above its 2015 high, unconfirmed by every stock index in the US and every major stock index in the world. Like the SPX and NDX, the FTSE also looks as if it has completed an Elliott wave Ending Diagonal Triangle. If so, it is vulnerable to a rapid decline to the point of origin made on February 11th. Note the RSI has a double bearish divergence vs. the early October top and the mid-August peak. The SPX has been making market turns measured in trading days. Sometimes market turns can be measured in calendar days. Adding a Fibonacci 21 calendar days to the FTSE October 11th peak targets November 1st as a possible market turn day. |
|
| Figure 3. The FTSE may be the last major index in the world to make a new all-high in 2016. |
| Graphic provided by: BigCharts.com. |
| |
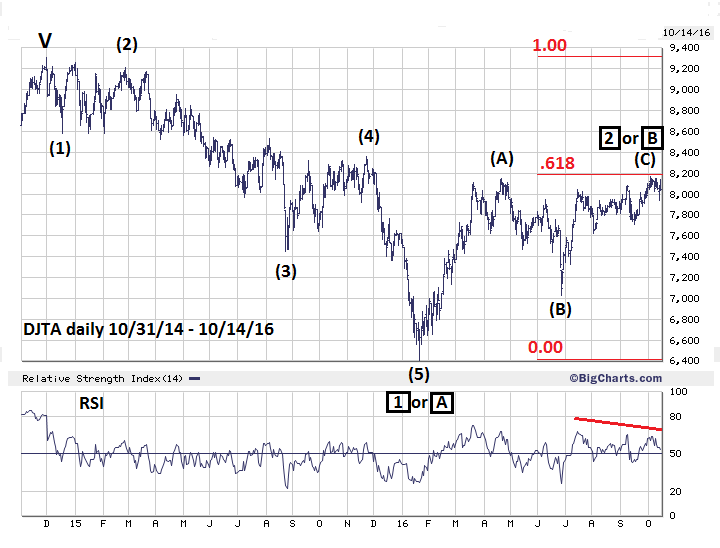
| Dow Jones Transportation Average - Update My article "Stock Market Lessons from Mr. Fibonacci - Part Three" noted the Dow Jones Transportation Average (DJTA) may have had an important secondary peak with a truncated Elliott wave (C). Please see the DJTA daily chart illustrated in Figure 4. On October 4th the DJTA moved above the mid-April top labeled (A) and confirmed an Elliott wave Zigzag up from the January bottom. The supposed wave (C) topped just below a Fibonacci .618 retrace of the entire bear move from December 2014-January 2016 and was accompanied by a double bearish divergence on the daily RSI. If the October 4th top holds, it implies the next move down could reach — at a minimum — the January 2016 bottom. |
|
| Figure 4. If the October 4th top holds it implies the next move down could reach, at a minimum, the January 2016 bottom. |
| Graphic provided by: BigCharts.com. |
| |
| Strategy and Summary The stop loss level to exit all long stock positions at SPX 2118 was triggered on October 13th. Subsequently, the SPX rallied back to 2149 then began a new decline. Increase the short position to 100% if the SPX breaks below 2114 and lower the stop loss from 2270 to 2194. The SPX narrow trading range could end with a sharp downside break in just a few trading days, perhaps as soon as October 17th. A sharp stock decline in late October would probably be big surprise to most investors and traders. By studying the market dimensions of price, time, sentiment and momentum, you are prepared for this contingency and can profit from what could be the best trading opportunity of the year. Further Reading: Frost A.J and Robert Prechter (1985) "Elliott Wave Principle", New Classics Library. Williams Larry (1988) "The Definitive Guide to Futures Trading", Windsor Books. |
Independent investment advisor, trader and writer. He has written articles for Technical Analysis of Stocks & Commodities, Traders.com Advantage,Futuresmag.com and, Finance Magnates. Author of website Four Dimension Trading.
| Website: | www.fourdimensiontrading.com |
| E-mail address: | markrivest@gmail.com |
Click here for more information about our publications!
Comments
Date:�10/22/16Rank:�5Comment:�Good reading. I might be having a confirmation bias issue, but this article nicely states what I have been watching and thinking myself.
Date:�10/29/16Rank:�5Comment:�
Date:�10/29/16Rank:�5Comment:�This is the most insightful and useful article of this year in the magazine!

Request Information From Our Sponsors
- StockCharts.com, Inc.
- Candle Patterns
- Candlestick Charting Explained
- Intermarket Technical Analysis
- John Murphy on Chart Analysis
- John Murphy's Chart Pattern Recognition
- John Murphy's Market Message
- MurphyExplainsMarketAnalysis-Intermarket Analysis
- MurphyExplainsMarketAnalysis-Visual Analysis
- StockCharts.com
- Technical Analysis of the Financial Markets
- The Visual Investor
- VectorVest, Inc.
- Executive Premier Workshop
- One-Day Options Course
- OptionsPro
- Retirement Income Workshop
- Sure-Fire Trading Systems (VectorVest, Inc.)
- Trading as a Business Workshop
- VectorVest 7 EOD
- VectorVest 7 RealTime/IntraDay
- VectorVest AutoTester
- VectorVest Educational Services
- VectorVest OnLine
- VectorVest Options Analyzer
- VectorVest ProGraphics v6.0
- VectorVest ProTrader 7
- VectorVest RealTime Derby Tool
- VectorVest Simulator
- VectorVest Variator
- VectorVest Watchdog