

HOT TOPICS LIST
- MACD
- Fibonacci
- RSI
- Gann
- ADXR
- Stochastics
- Volume
- Triangles
- Futures
- Cycles
- Volatility
- ZIGZAG
- MESA
- Retracement
- Aroon
INDICATORS LIST
LIST OF TOPICS
PRINT THIS ARTICLE
by Matt Blackman
GM used to be a stock market bellwether and what it's saying now has decidedly bearish implications.
Position: N/A
Matt Blackman
Matt Blackman is a full-time technical and financial writer and trader. He produces corporate and financial newsletters, and assists clients in getting published in the mainstream media. He is the host of TradeSystemGuru.com. Matt has earned the Chartered Market Technician (CMT) designation. Find out what stocks and futures Matt is watching on Twitter at www.twitter.com/RatioTrade
PRINT THIS ARTICLE
HEAD & SHOULDERS
General Motors Chart Speaks Volumes
04/01/14 03:24:03 PMby Matt Blackman
GM used to be a stock market bellwether and what it's saying now has decidedly bearish implications.
Position: N/A
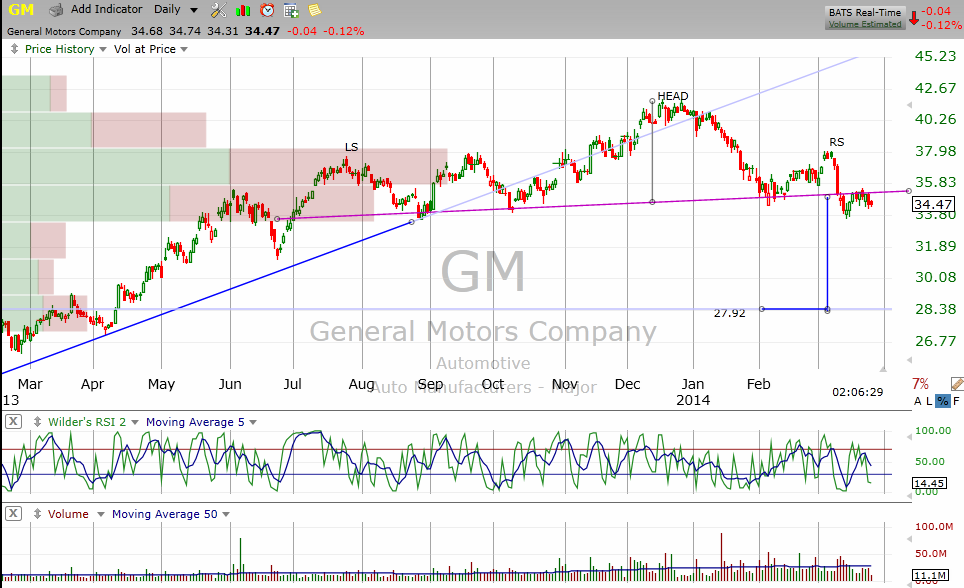
| As I wrote in my article "Is CAT the New GM Market Proxy," before it went bankrupt, GM was a good indicator for the overall US stock market and was even the source of an indicator developed by Martin Pring called the Four Month Rule. Since being re-launched in 2010, it has yet to prove that it will reacquire its past proxy glory but if it still holds any value, what the stock is saying about the market now is decidedly bearish. As we see in Figure 1, GM decisively broke its head & shoulders neckline support (magenta line) on March 12, 2014 and a weak rally attempt to break above the neckline failed thereby reaffirming it as major resistance (Figure 1). |
|
| Figure 1 � Daily chart of the new General Motors showing the latest bearish chart pattern with projected downside target. |
| Graphic provided by: TC2000.com. |
| |
| According to Reuters, GM announced February 6, 2014 that it was recalling 1.6 million vehicles due to concerns that faulty ignition switches could unexpectedly shut off the engines while operating and make air bags inoperable in crashes. The US Senate Panel will hold its first hearing on April 2, 2014 on the problem which has been linked to 12 deaths according to the report. This is not the kind of publicity the company needs, especially since it's a problem that dates back to 2001. Neither does a class action lawsuit filed in San Francisco during the week of March 25, 2014 claiming that a larger number of GM vehicles than the 1.6 million recalled have problems. Two more lawsuits against the company were launched on March 24, 2014 (see http://goo.gl/bMgPxq). |
|
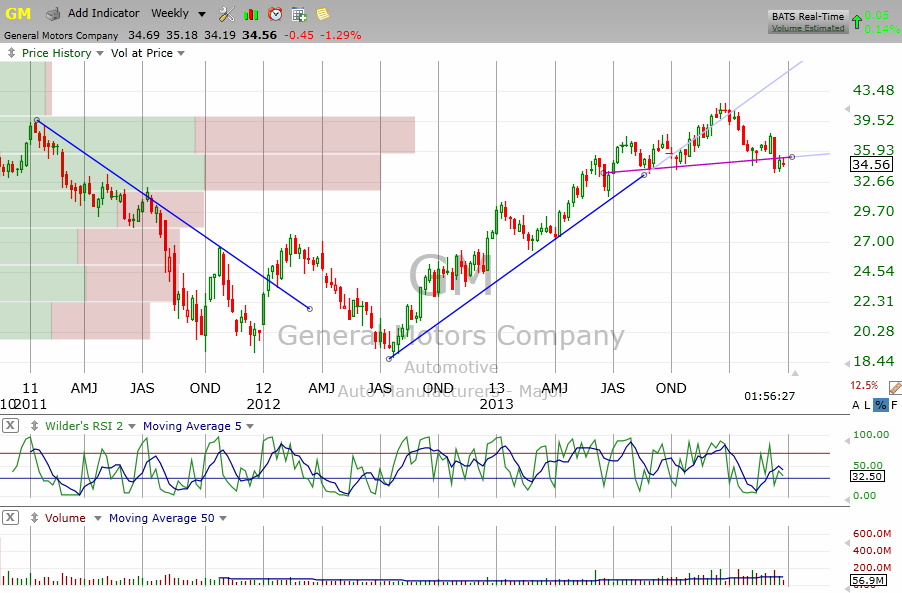
| Figure 2 � Longer term weekly chart of GM showing how the stock struggled after re-launch then came back. Note the major volume at price resistance between $36 and $40. |
| Graphic provided by: TC2000.com. |
| |
| This is another example of how prices tend to lead the fundamentals. Uptrend support was broken in October 2013 and the head of the head & shoulders pattern peaked well ahead of the February 6, 2014 recall announcement. By the time the announcement was made, the stock had dropped more than 10% from its peak before launching a brief rally to create the right shoulder, which peaked in the first week of February. In other words, sellers began outnumbering buyers long before the lawsuit was publicly announced. |
| This type of pattern is not isolated in US markets — topping patterns are appearing in a number of prior market leaders such as NetFlix (NFLX), Facebook (FB), Google (GOOG), Amazon (AMZN), Apple (AAPL), JinkoSolar (JKS), and another proven market and bubble proxy, Sotheby's (BID) (see "BID Bubble Update"). |
| The minimum projected downside target for the GM head & shoulders pattern is $27.92 which is 20% below where it closed on March 26, 2014. For the Elliott Wave perspective and analysis of the stock, please see "GM: Generally Bearish Charts". |
Matt Blackman is a full-time technical and financial writer and trader. He produces corporate and financial newsletters, and assists clients in getting published in the mainstream media. He is the host of TradeSystemGuru.com. Matt has earned the Chartered Market Technician (CMT) designation. Find out what stocks and futures Matt is watching on Twitter at www.twitter.com/RatioTrade
| Company: | TradeSystemGuru.com |
| Address: | Box 2589 |
| Garibaldi Highlands, BC Canada | |
| Phone # for sales: | 604-898-9069 |
| Fax: | 604-898-9069 |
| Website: | www.tradesystemguru.com |
| E-mail address: | indextradermb@gmail.com |
Traders' Resource Links | |
| TradeSystemGuru.com has not added any product or service information to TRADERS' RESOURCE. | |
Click here for more information about our publications!
Comments

Request Information From Our Sponsors
- StockCharts.com, Inc.
- Candle Patterns
- Candlestick Charting Explained
- Intermarket Technical Analysis
- John Murphy on Chart Analysis
- John Murphy's Chart Pattern Recognition
- John Murphy's Market Message
- MurphyExplainsMarketAnalysis-Intermarket Analysis
- MurphyExplainsMarketAnalysis-Visual Analysis
- StockCharts.com
- Technical Analysis of the Financial Markets
- The Visual Investor
- VectorVest, Inc.
- Executive Premier Workshop
- One-Day Options Course
- OptionsPro
- Retirement Income Workshop
- Sure-Fire Trading Systems (VectorVest, Inc.)
- Trading as a Business Workshop
- VectorVest 7 EOD
- VectorVest 7 RealTime/IntraDay
- VectorVest AutoTester
- VectorVest Educational Services
- VectorVest OnLine
- VectorVest Options Analyzer
- VectorVest ProGraphics v6.0
- VectorVest ProTrader 7
- VectorVest RealTime Derby Tool
- VectorVest Simulator
- VectorVest Variator
- VectorVest Watchdog