

HOT TOPICS LIST
- MACD
- Fibonacci
- RSI
- Gann
- ADXR
- Stochastics
- Volume
- Triangles
- Futures
- Cycles
- Volatility
- ZIGZAG
- MESA
- Retracement
- Aroon
INDICATORS LIST
LIST OF TOPICS
PRINT THIS ARTICLE
by Matt Blackman
As the world's largest maker of construction and mining equipment, where Caterpillar stock goes tells us much about the state of the market. So what is CAT telling us now?
Position: N/A
Matt Blackman
Matt Blackman is a full-time technical and financial writer and trader. He produces corporate and financial newsletters, and assists clients in getting published in the mainstream media. He is the host of TradeSystemGuru.com. Matt has earned the Chartered Market Technician (CMT) designation. Find out what stocks and futures Matt is watching on Twitter at www.twitter.com/RatioTrade
PRINT THIS ARTICLE
BULL/BEAR MARKET
Is CAT The New GM Market Proxy?
10/28/13 05:03:08 PMby Matt Blackman
As the world's largest maker of construction and mining equipment, where Caterpillar stock goes tells us much about the state of the market. So what is CAT telling us now?
Position: N/A
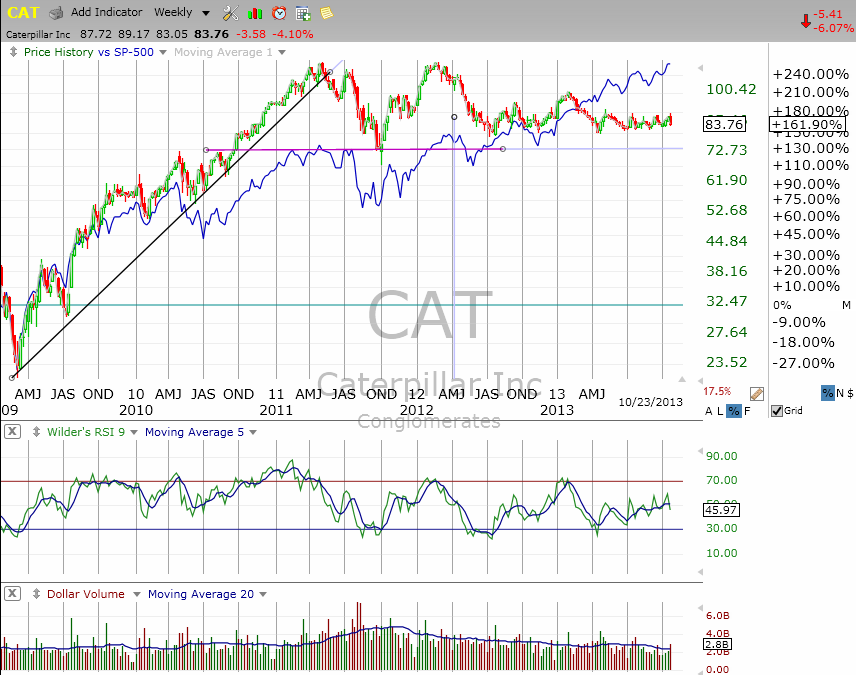
| Up until the 2007 financial crisis, a major contributor to GM bankruptcy, there was a well-worn Wall Street adage that said, "what's good for General Motors is good for America." Noted technical analyst and author Martin Pring discussed an indicator based on this premise in his book Technical Analysis Explained, that he called the Four-Month Rule (see The Four-Month Rule). In a nutshell it said that if GM failed to make a new market high or low within four calendar months of its previous peak or trough, the trend of the stock market had reversed or was about to do so. GM is no longer the proxy it once was, but a case can be made that Caterpillar (CAT) has taken its place. As we see in Figure 1, CAT shows a double market top with peaks in 2011 and 2012 and has failed to put in a new high since around February 2012. Granted, the double top in Figure 1 had yet to be formally confirmed as of October 2013 with a decisive breach of the purple neckline, the bearish negative divergence with the SPX is clear. |
|
| Figure 1 � Weekly chart comparing Caterpillar Inc (CAT) with the S&P 500 Index (blue line) since the rally began in 2009. |
| Graphic provided by: TC2000.com. |
| |
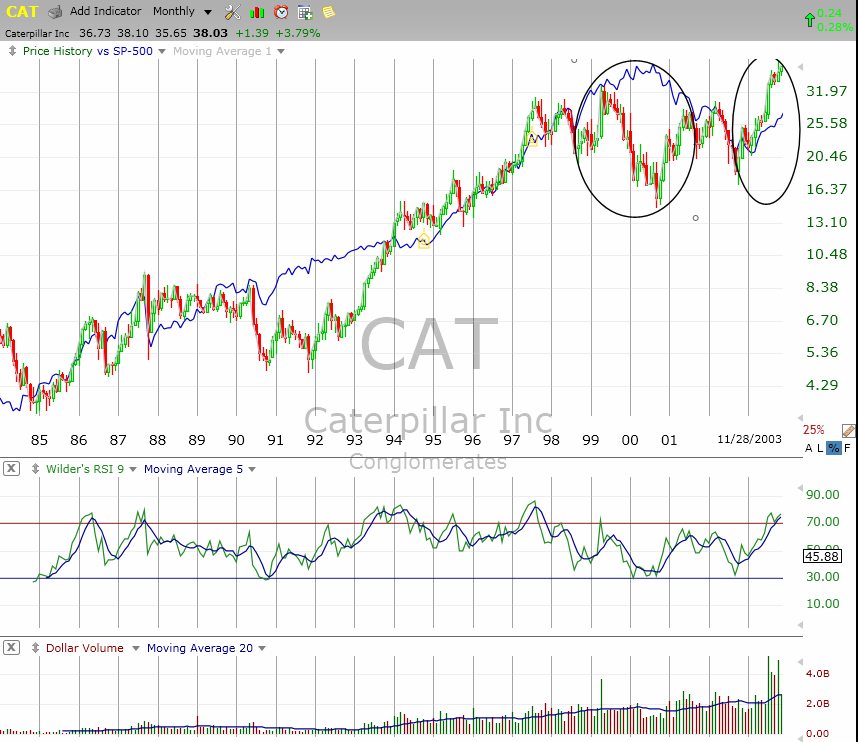
| We see the relationship between CAT and the SPX in Figure 2 looking at a longer snippet of history using the monthly chart. Note that CAT peaked and began negatively diverging with the SPX in early 1999 failing to put in a new high while the SPX continued higher for more than a year before it peaked. CAT also bottomed in November 2000, positively diverging with stocks for more than two years before the SPX bottomed in early 2003. Caterpillar then put in a new high in July 2003, nearly four years before the SPX registered its new high in May 2007. CAT then registered another new high in December 2010 — a situation which would not occur in the SPX until April 2013. In other words, CAT has consistently given lots of advance warning of weakness and strength in US stocks. The bearish reversal warning was much more subtle in 2007 as CAT put in a lower top in October 2007 while the SPX put in a higher top — likely due to sustained growth in the mining and construction sectors in China while strength waned in developed nations. In 2009, the CAT bottom occurred at around the same time as the SPX so not much of a reversal warning there. |
|
| Figure 2 � Monthly chart comparing Caterpillar with the S&P500 Index (blue) showing how CAT led the overall stock market between 1985 and 2003. |
| Graphic provided by: TC2000.com. |
| |
| So what's been happening since then? Caterpillar cut its sales and profit forecast in its October 2013 earnings report due to a slump in orders from commodity producers according to Bloomberg. It said earnings would fall to about $5.50 per share down from a July forecast of $6.50. The news caused CAT shares to fall more than 6 percent, the most in two years. Share prices have fallen more than 27% since their peak in February 2012. |
| Although not perfect, the Caterpillar four-month rule has value and the recent bearish divergence and stock weakness must be considered a negative omen for U.S. stock prices going forward. Given the global scope of the company, there is also a good chance that it may be telling us a similar story about global stock prices. The question remains as to when this reversal will come and how much of a factor global quantitative easing efforts, which have been a major driver behind bullish stock behavior, will delay this signal. |
Matt Blackman is a full-time technical and financial writer and trader. He produces corporate and financial newsletters, and assists clients in getting published in the mainstream media. He is the host of TradeSystemGuru.com. Matt has earned the Chartered Market Technician (CMT) designation. Find out what stocks and futures Matt is watching on Twitter at www.twitter.com/RatioTrade
| Company: | TradeSystemGuru.com |
| Address: | Box 2589 |
| Garibaldi Highlands, BC Canada | |
| Phone # for sales: | 604-898-9069 |
| Fax: | 604-898-9069 |
| Website: | www.tradesystemguru.com |
| E-mail address: | indextradermb@gmail.com |
Traders' Resource Links | |
| TradeSystemGuru.com has not added any product or service information to TRADERS' RESOURCE. | |
Click here for more information about our publications!
Comments

Request Information From Our Sponsors
- StockCharts.com, Inc.
- Candle Patterns
- Candlestick Charting Explained
- Intermarket Technical Analysis
- John Murphy on Chart Analysis
- John Murphy's Chart Pattern Recognition
- John Murphy's Market Message
- MurphyExplainsMarketAnalysis-Intermarket Analysis
- MurphyExplainsMarketAnalysis-Visual Analysis
- StockCharts.com
- Technical Analysis of the Financial Markets
- The Visual Investor
- VectorVest, Inc.
- Executive Premier Workshop
- One-Day Options Course
- OptionsPro
- Retirement Income Workshop
- Sure-Fire Trading Systems (VectorVest, Inc.)
- Trading as a Business Workshop
- VectorVest 7 EOD
- VectorVest 7 RealTime/IntraDay
- VectorVest AutoTester
- VectorVest Educational Services
- VectorVest OnLine
- VectorVest Options Analyzer
- VectorVest ProGraphics v6.0
- VectorVest ProTrader 7
- VectorVest RealTime Derby Tool
- VectorVest Simulator
- VectorVest Variator
- VectorVest Watchdog