HOT TOPICS LIST
- MACD
- Fibonacci
- RSI
- Gann
- ADXR
- Stochastics
- Volume
- Triangles
- Futures
- Cycles
- Volatility
- ZIGZAG
- MESA
- Retracement
- Aroon
INDICATORS LIST
LIST OF TOPICS
PRINT THIS ARTICLE
by Matt Blackman
According to the 2011 book "Boombustology" by Vikram Mansharaman, auctioneer Sotheby's has proven to be a valuable market bubble indicator. So what has the stock been saying lately?
Position: N/A
Matt Blackman
Matt Blackman is a full-time technical and financial writer and trader. He produces corporate and financial newsletters, and assists clients in getting published in the mainstream media. He is the host of TradeSystemGuru.com. Matt has earned the Chartered Market Technician (CMT) designation. Find out what stocks and futures Matt is watching on Twitter at www.twitter.com/RatioTrade
PRINT THIS ARTICLE
BULL/BEAR MARKET
BID Bubble Indicator Update
09/25/13 03:52:11 PMby Matt Blackman
According to the 2011 book "Boombustology" by Vikram Mansharaman, auctioneer Sotheby's has proven to be a valuable market bubble indicator. So what has the stock been saying lately?
Position: N/A
| Not long after going public in 1988, Sotheby's (BID) had jumped 375% from September 1988 to October 19, 1989, peaking more than two months before the Nikkei 225 Index peak. BID then warned of a peak again: this time in the US markets in April 1999, 11 months before the Standard & Poor's 500 and NASDAQ peaked in March 2000. BID peaked next in October 2007 around the same time as the SPX. Its latest peak occurred in the first week of April 2011 nearly one month ahead of the SPX. From peak to trough BID dropped approximately 50% compared to a drop of 17% for the SPX by the end of September 2011. (I discuss this indicator in greater detail in a Working Money article entitled "Could One Stock Provide A Reliable Bubble Meter?" |
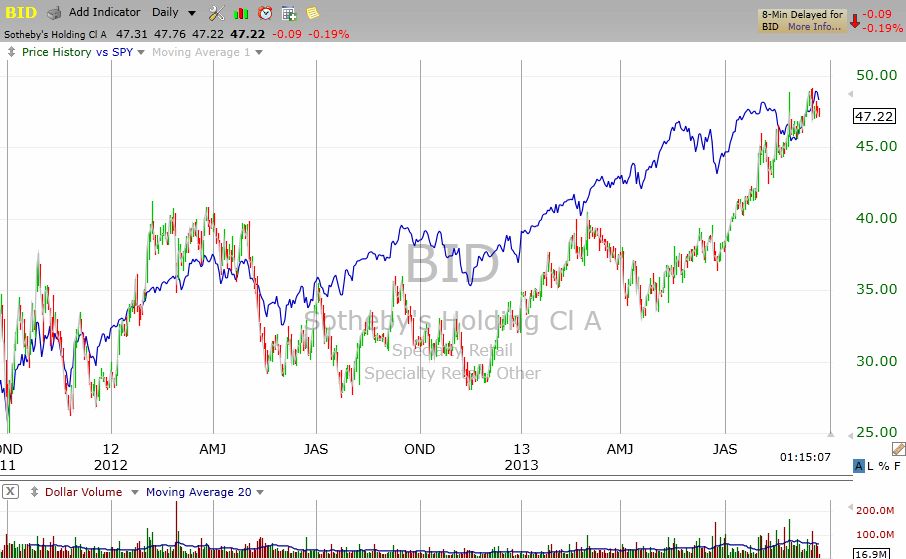
| So what has the stock been doing lately? As we see in Figure 1, BID had rallied more than 40% from mid-April before peaking on September 12, 2013, compared to a run of roughly 11% for the SPX over the same period. Only time will tell if this peak will be surpassed in 2013 or not. |

|
| Figure 1 – Daily chart comparing Sotheby’s (BID) and the S&P500 Index showing the latest peaks on the right-hand side of the chart in mid-September 2013. |
| Graphic provided by: TC2000.com. |
| |
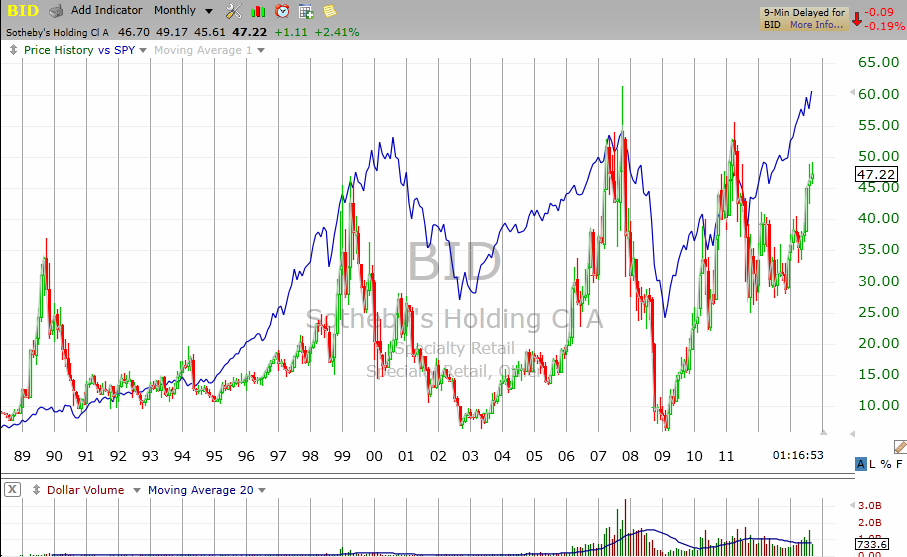
| As we see from the longer term chart back to 1988 (Figure 2), the SPX continued to rally higher in 2013 while BID rallied towards a lower high. |

|
| Figure 2 – Monthly chart showing BID from 1988 compared to the SPX. Note the timing of the peaks in each and how they coincide. |
| Graphic provided by: TC2000.com. |
| |
| Based on the history of Sotheby's, if the stock fails to post a higher high in September or early October, look out. The stock is now showing negative divergence with the SPX, which is a bearish omen. |
| If, however, BID does put in a higher high, it should continue to be a good way to play the rally as long as it lasts and if history is any guide, should continue to provide advance, or at the very worst, coincident indication of the next top in stocks. SUGGESTED READING Blackman, Matt [2011]. "Is Sotheby's A Bubble Proxy?" Traders.com Advantage, May 13. Mansharamani, Vikram [2011]. Boom, Bustology: Spotting Financial Bubbles Before They Bust, John Wiley & Sons. |
Matt Blackman is a full-time technical and financial writer and trader. He produces corporate and financial newsletters, and assists clients in getting published in the mainstream media. He is the host of TradeSystemGuru.com. Matt has earned the Chartered Market Technician (CMT) designation. Find out what stocks and futures Matt is watching on Twitter at www.twitter.com/RatioTrade
| Company: | TradeSystemGuru.com |
| Address: | Box 2589 |
| Garibaldi Highlands, BC Canada | |
| Phone # for sales: | 604-898-9069 |
| Fax: | 604-898-9069 |
| Website: | www.tradesystemguru.com |
| E-mail address: | indextradermb@gmail.com |
Traders' Resource Links | |
| TradeSystemGuru.com has not added any product or service information to TRADERS' RESOURCE. | |
Click here for more information about our publications!
PRINT THIS ARTICLE

Request Information From Our Sponsors
- StockCharts.com, Inc.
- Candle Patterns
- Candlestick Charting Explained
- Intermarket Technical Analysis
- John Murphy on Chart Analysis
- John Murphy's Chart Pattern Recognition
- John Murphy's Market Message
- MurphyExplainsMarketAnalysis-Intermarket Analysis
- MurphyExplainsMarketAnalysis-Visual Analysis
- StockCharts.com
- Technical Analysis of the Financial Markets
- The Visual Investor
- VectorVest, Inc.
- Executive Premier Workshop
- One-Day Options Course
- OptionsPro
- Retirement Income Workshop
- Sure-Fire Trading Systems (VectorVest, Inc.)
- Trading as a Business Workshop
- VectorVest 7 EOD
- VectorVest 7 RealTime/IntraDay
- VectorVest AutoTester
- VectorVest Educational Services
- VectorVest OnLine
- VectorVest Options Analyzer
- VectorVest ProGraphics v6.0
- VectorVest ProTrader 7
- VectorVest RealTime Derby Tool
- VectorVest Simulator
- VectorVest Variator
- VectorVest Watchdog
