HOT TOPICS LIST
- MACD
- Fibonacci
- RSI
- Gann
- ADXR
- Stochastics
- Volume
- Triangles
- Futures
- Cycles
- Volatility
- ZIGZAG
- MESA
- Retracement
- Aroon
INDICATORS LIST
LIST OF TOPICS
PRINT THIS ARTICLE
by Donald W. Pendergast, Jr.
Shares of General Motors appear to have begun their descent again as a powerful C-wave correction unfolds.
Position: N/A
Donald W. Pendergast, Jr.
Freelance financial markets writer and online publisher of the Trendzetterz.com S&P 500 Weekly Forecast service.
PRINT THIS ARTICLE
TREND-CHANNEL
GM: Generally Bearish Charts
03/21/14 03:08:29 PMby Donald W. Pendergast, Jr.
Shares of General Motors appear to have begun their descent again as a powerful C-wave correction unfolds.
Position: N/A
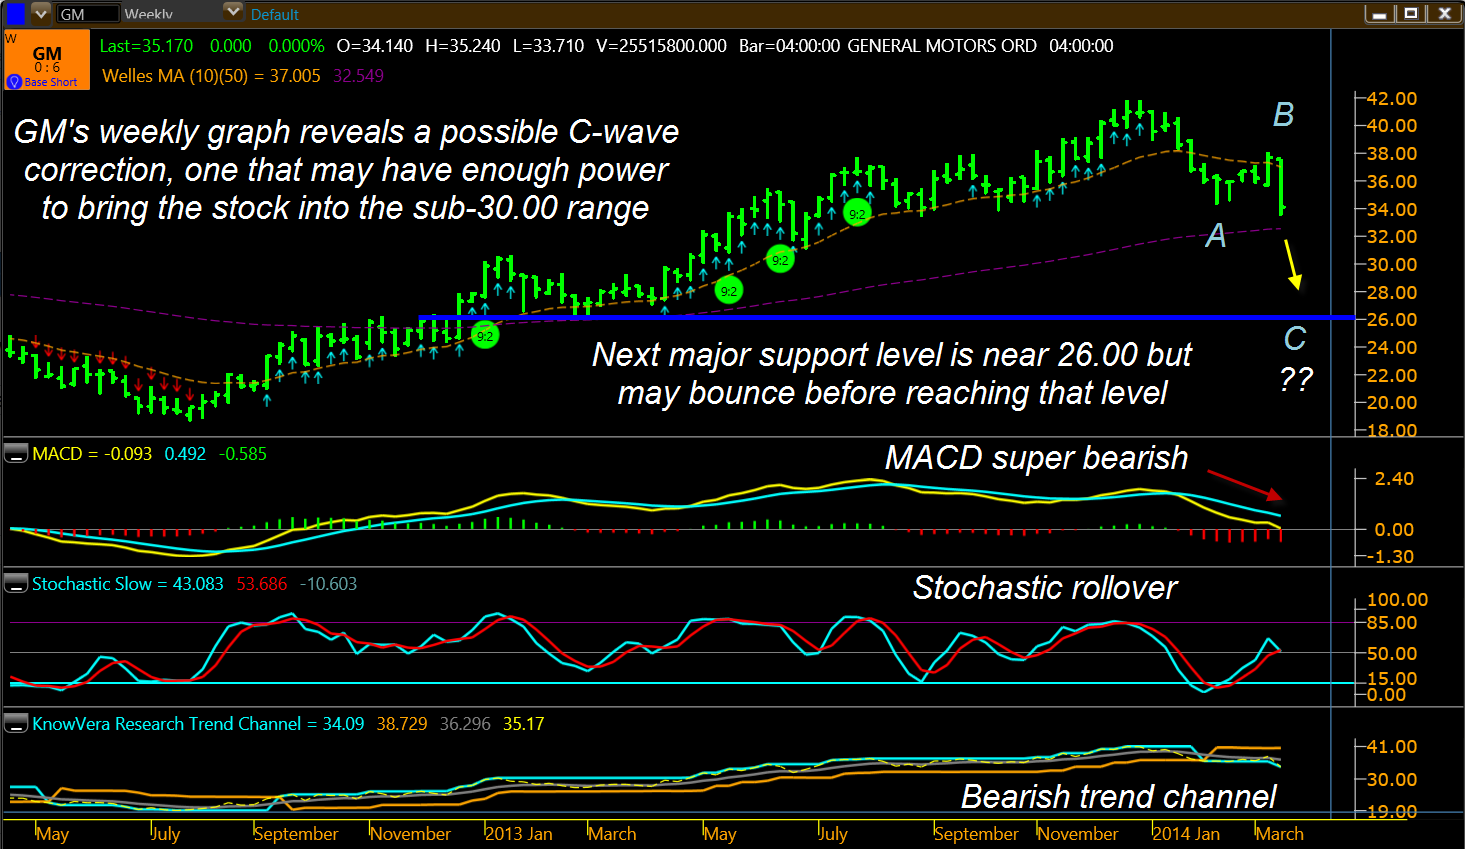
| Charles Wilson was once quoted as saying "As goes General Motors, so goes the Nation." That was a long, long time ago but it may still be a valid saying even today, especially with the US stock indexes still trading near their all-time highs after an epic five-year rally. Anyone who is 50 years of age or older can certainly recall the days when General Motors (GM) was the premier US manufacturing corporation and when it had the ability to dominate the US auto market with ease. That era (1920s thru 1990s) is long behind us and will likely never be repeated again, but since new car/truck sales are a terrific bellwether of the current (and future) health of the US and global economy, it still pays to keep an eye on GM's charts. Here's a closer look at GM's weekly chart (Figure 2), and the picture it paints isn't looking too robust for the economy at large. |

|
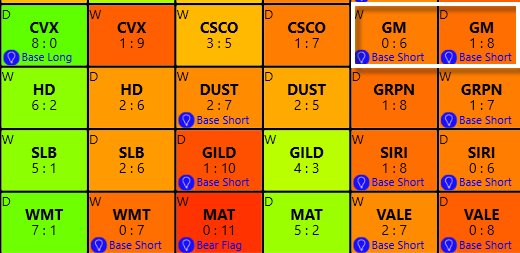
| Figure 1. General Motors (GM); with 'base short' rankings on its daily and weekly time frames, shares of the stock appear to be in the control of a bearish weekly ABC corrective pattern. |
| Graphic provided by: KnowVera Research LLC. |
| |
| GM made a major swing high in the last week of 2013 and has since sold off by more than 18% as a major ABC Elliott Wave corrective pattern has unfolded. Based on the current pattern, waves A and B are complete and the powerful C-wave forces are now pushing the stock lower. Elliotticians know that the C wave of the ABC pattern is the most bearish of the three waves and that it can and does have the ability to do the bulk of the corrective work of the pattern, particularly after an unusually long bull run in a given market. Bear in mind (pardon pun) that as price patterns evolve, relabeling is sometimes necessary; this ABC could actually be part of a far larger and more devastating ABC pattern where the current three-wave decline is merely part of a wave A in progress. All we can do is watch the pattern evolve and then we'll know which is the correct labeling. Be that as it may, there are many bearish forces at work on GM's weekly chart: 1. Trend score is 0:6 and is ranked as a 'base short' setup. 2. MACD is very bearish. 3. Stochastic has rolled over to bearish. 4. Trend channel is still bearish. 5. Monthly stochastic is also in bearish mode. 5. GM's daily chart has a trend score of 1:8 and is also ranked as a 'base short.' Based on Fibonacci swing ratios, the current C-wave decline termination levels are as follows: 1. 30.56 2. 28.54 3. 25.93 These are idealized levels, based on Fibonacci ratios of 100%, 127% and 162%; any one of them can act as support for a relief rally but the strongest chart support is near the 26.00 level and that's where the 162% swing is expected to fizzle out — at 25.93 — making the 26.00 area a high probability zone to expect a major rally phase, even if counter-trend in nature. |

|
| Figure 2. GM's weekly chart reveals a decisively bearish set of trend dynamics; wave C has the potential to decline toward major support at 26.00. |
| Graphic provided by: KnowVera Research LLC. |
| |
| If you're currently short GM, you are in the catbird seat right now; if GM approaches 30.75 consider running a closer trailing stop and/or lightening up on your short position, holding on for bigger potential declines below 29.00. By all means don't be short anywhere near the major support zone near 26.00, no matter how bearish you may be on GM or the markets in general (pardon pun - again). In fact, look for a low risk buying opportunity near 26.00 once this correction finally exhausts itself. Trade wisely until we meet here again. |
Freelance financial markets writer and online publisher of the Trendzetterz.com S&P 500 Weekly Forecast service.
| Title: | Market consultant and writer |
| Company: | Trendzetterz |
| Address: | 81 Hickory Hollow Drive |
| Crossville, TN 38555 | |
| Phone # for sales: | 904-303-4814 |
| Website: | trendzetterz.com |
| E-mail address: | support@trendzetterz.com |
Traders' Resource Links | |
| Trendzetterz has not added any product or service information to TRADERS' RESOURCE. | |
Click here for more information about our publications!
PRINT THIS ARTICLE

Request Information From Our Sponsors
- VectorVest, Inc.
- Executive Premier Workshop
- One-Day Options Course
- OptionsPro
- Retirement Income Workshop
- Sure-Fire Trading Systems (VectorVest, Inc.)
- Trading as a Business Workshop
- VectorVest 7 EOD
- VectorVest 7 RealTime/IntraDay
- VectorVest AutoTester
- VectorVest Educational Services
- VectorVest OnLine
- VectorVest Options Analyzer
- VectorVest ProGraphics v6.0
- VectorVest ProTrader 7
- VectorVest RealTime Derby Tool
- VectorVest Simulator
- VectorVest Variator
- VectorVest Watchdog
- StockCharts.com, Inc.
- Candle Patterns
- Candlestick Charting Explained
- Intermarket Technical Analysis
- John Murphy on Chart Analysis
- John Murphy's Chart Pattern Recognition
- John Murphy's Market Message
- MurphyExplainsMarketAnalysis-Intermarket Analysis
- MurphyExplainsMarketAnalysis-Visual Analysis
- StockCharts.com
- Technical Analysis of the Financial Markets
- The Visual Investor
